Get ready to experience monitoring like never before! The latest features in FusionReactor Agent 2025.2 are transforming how you interact with your application data in FusionReactor Cloud.
This release isn’t just an update; it’s a complete redesign of your diagnostic workflow, blending real-time monitoring with deep AI-powered insights. We’re setting the stage for a new era of proactive operations.
Before we dive into the details of each new section in future posts, here is a breakdown of the key innovations you can start using today.
1. Dynamic new Servers view: Live & historical power
The days of static server lists are over. Your new default view—the Server Cubes interface—delivers immediate, visual insight into your fleet’s health.
- Real-time health with configurable thresholds: Servers are represented by intuitive, color-coded cubes (Blue for healthy, red for errors) that update continuously. The thresholds that determine the cube’s color are now fully configurable, allowing you to tailor alerts to your specific operational needs. You instantly detect incidents as they occur.
- Time-travel for troubleshooting: Toggle off live data to access a powerful time picker that lets you view server activity across a 30-day window. Critically, this view now exposes servers that were offline during that time, ensuring you never miss the historical context of a restart or failure.
- Effortless navigation: Built-in filtering lets you instantly narrow your view by groups (e.g., dev, prod) or specific server names, making scaling manageable.

2. OpsPilot: AI built directly into your workflow
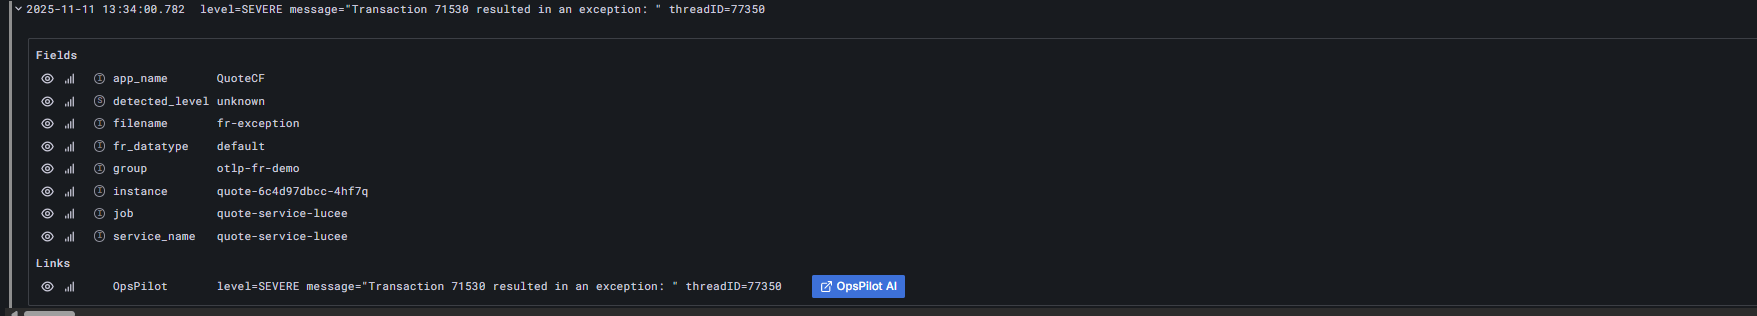
FusionReactor Cloud doesn’t just show you what’s wrong; it helps you understand why. OpsPilot, our AI diagnostic assistant, is now embedded directly into the core application view—it’s not a separate chat window, it’s a diagnostic superpower:
- One-click analysis: From your Error History or Event Snapshots, simply click “Ask OpsPilot” to get immediate root cause analysis, plain-language explanations, and suggested optimizations for complex issues like SQL errors or unexpected exceptions.
- Profiler insight: Instantly make sense of complex performance data. OpsPilot analyzes request profiles to pinpoint code bottlenecks and locking issues and offers optimization advice, making profiling accessible to everyone.
- Intelligent JDBC: Even the hardest problems—database performance—are simplified. OpsPilot analyzes individual JDBC statements to detect inefficiencies and blocking behaviors.
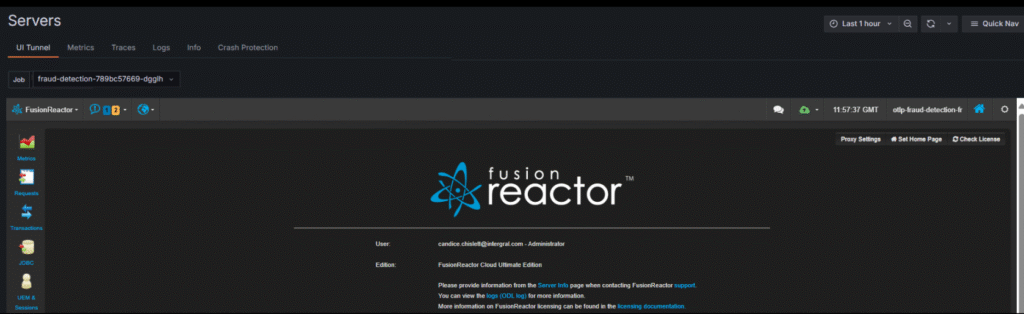
3. The Tunnel: Live data & AI at your fingertips
Introducing The Tunnel, a feature that cuts through the noise to give you direct access to live, ongoing data streams.
- Live data view: The Tunnel lets you view live data from your applications, providing a real-time, high-fidelity view of your operations.
- AI-enhanced: The Tunnel integrates AI to analyze the incoming stream and proactively highlight emerging patterns or potential issues before they escalate.
4. Unified observability: Metrics, logs, & traces with dynamic context
The new individual server view consolidates all your application data into a powerful, unified interface, improving speed and context retention.
While Metrics, Logs, and Traces are typically historic views, they now benefit from a revolutionary approach to continuity:
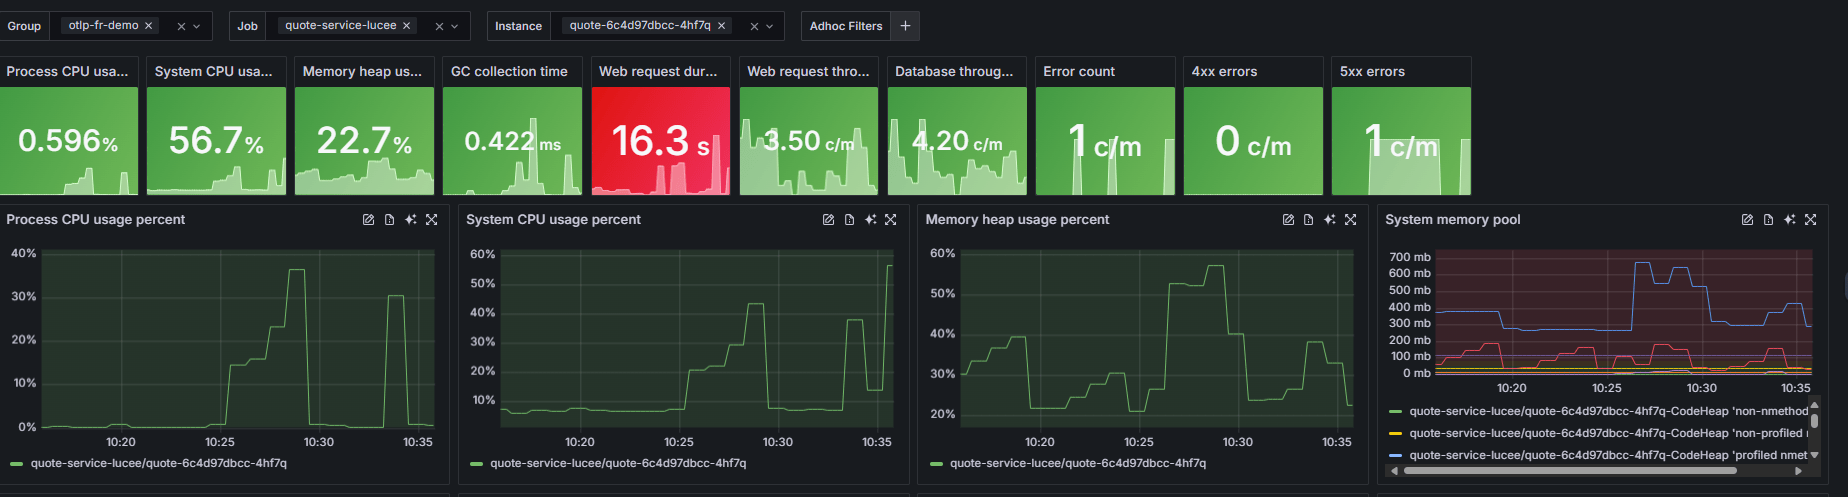
- Centralized metrics viewer: View all essential server health data (memory, GC, throughput) on one clear page. You can customize thresholds, zoom into specific timeframes, and even get OpsPilot to analyze a strange spike on any graph.
- Context persistence / Dynamic context: The time frame and server filters you set (for example, in the Metrics view) are persisted as you move between the Traces and Logs sections—you can switch tabs, but the filters stay. This eliminates repetitive setup and maintains your focus for seamless troubleshooting.
- Advanced tracing with Snapshots and Profiles: The new Traces view includes powerful built-in filtering, including a minimum duration filter and a new Span Name Filter for ultra-precise trace analysis. Crucially, tracing now also includes detailed Snapshots and Profiles, providing richer data to help you pinpoint root causes. These updates are purpose-built to make finding answers/troubleshooting easier.
- Enhanced logs: View logs for multiple servers simultaneously and use smart text search and ad-hoc filters to quickly find anomalies.
5. Crash Protection in the Cloud with AI analysis
Crash Protection (CP) is now fully integrated, shipping event alerts and their detailed data directly to the Cloud UI for analysis.
- Lightning-fast analysis: CP event analysis is simplified by smart Click-to-Filter functionality. Click a thread name to instantly filter logs, or click a blocking object to see all dependent threads.
- Automatic CP explanation: Avoid the headache of manually interpreting complex thread dumps. Ask OpsPilot to analyze the CP alert; it will provide a clear explanation of why it fired, what was blocked, and the recommended solution (often simply “No action required”), saving you hours!

See it in action!
Ready to see these features in practice? Watch the video below to tour the new FusionReactor Cloud experience and witness the speed and power of OpsPilot firsthand.
This is just the beginning. Over the coming weeks, we will dedicate a blog post to each of these sections—the Server Cubes, the Metrics Viewer, Tracing, Logs, and OpsPilot—to give you an in-depth look at their capabilities.
Stay tuned, and happy monitoring!