In the past, every monitoring tool (like Datadog or New Relic) had its own “language.” If you wanted to switch tools, you had to rewrite your code.
OTLP is a universal language for your app’s data. It allows you to:
- Write code once: Instrument your app using standard OTel rules.
- Send it anywhere: Swap your monitoring vendor by changing one line of config – no code changes required.
Avoid “Lock-in”: You own your data format, not the vendor.
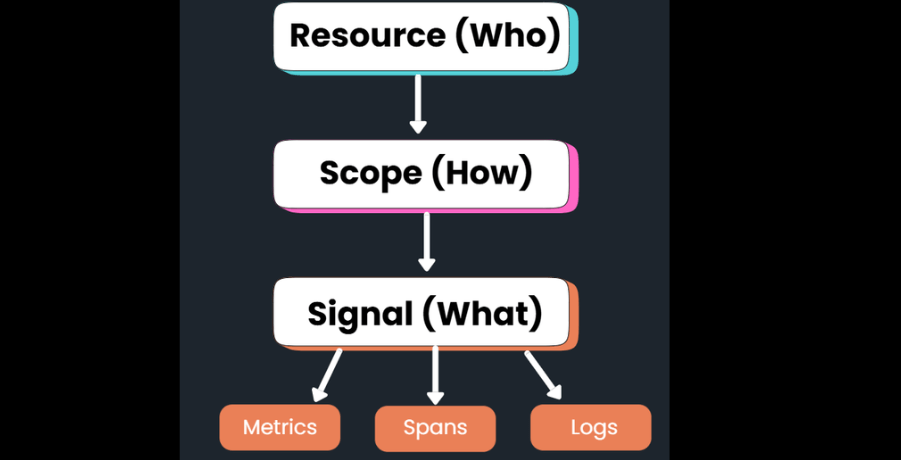
How it Works: The Data Hierarchy
OTLP doesn’t just send random data; it organizes it into a three-layer “envelope” so it makes sense when it arrives at your dashboard:
- 1. Resource (The Who): Identifies the service name, version, and where it’s running (e.g., “Checkout Service” on “AWS Node 5”).
- 2. Scope (The How): Identifies which specific library created the data (e.g., the “Express.js” plugin).
- 3. Signal (The What): The actual technical data – Traces, Metrics, or Logs.
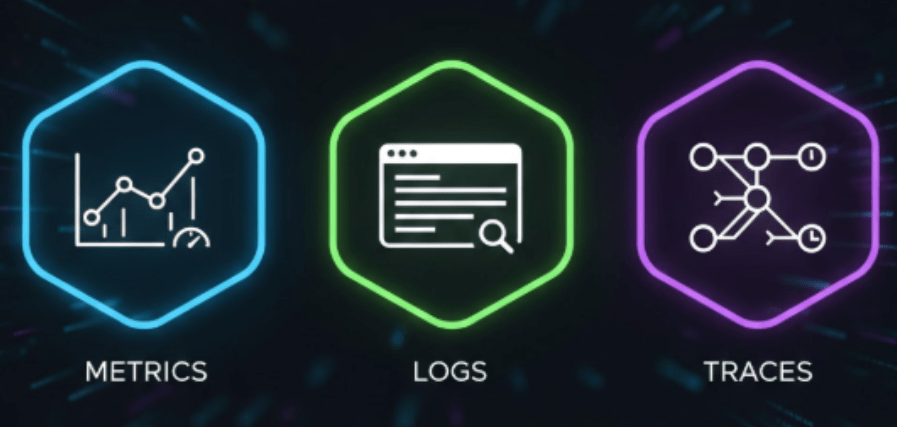
The Three Main “Signals”
OTLP handles the three pillars of observability in one streamlined format:
1. Traces (The Journey)
Traces tell the story of a request as it travels through your system. OTLP uses Spans (single steps like a database call) and connects them using a trace_id.
2. Metrics (The Vitals)
These are numbers over time. OTLP supports:
- Sums: Counters that go up (like total requests).
- Gauges: Current snapshots (like CPU temperature).
- Histograms: Groups of data (like “how many requests took under 100ms?”).
3. Logs (The Context)
OTLP doesn’t replace your logs; it bridges them. It takes logs from tools like Log4j or Pino and adds trace_id to them. This means you can click a slow trace and immediately see the exact logs from that specific error.
3 Steps to Using OTLP
- Instrument: Use an OpenTelemetry SDK in your app. It will automatically gather data and prepare it in OTLP format.
- The Collector: Use the OpenTelemetry Collector as a middleman. It can take in old formats (like Prometheus) and “translate” them into OTLP before sending them off.
- Choose a Backend: Send your data to a platform that is OTel-native (like FusionReactor).
- Why “Native” matters: Some tools “fake” support by converting OTLP into their own old format, which can lose detail. Native backends “speak” OTLP fluently, keeping your data 100% accurate.
Final Thoughts
OTLP is quickly becoming the universal language of modern observability. Standardizing how telemetry is described and moved, it provides a foundation that is open, consistent, and future-proof.
If you are investing in OpenTelemetry, don’t stop at the protocol. To get the most out of your data, pair it with a platform that is equally committed to the OTel standard.
Ready to see the power of OTel-native monitoring in action? Start your free trial with FusionReactor today.