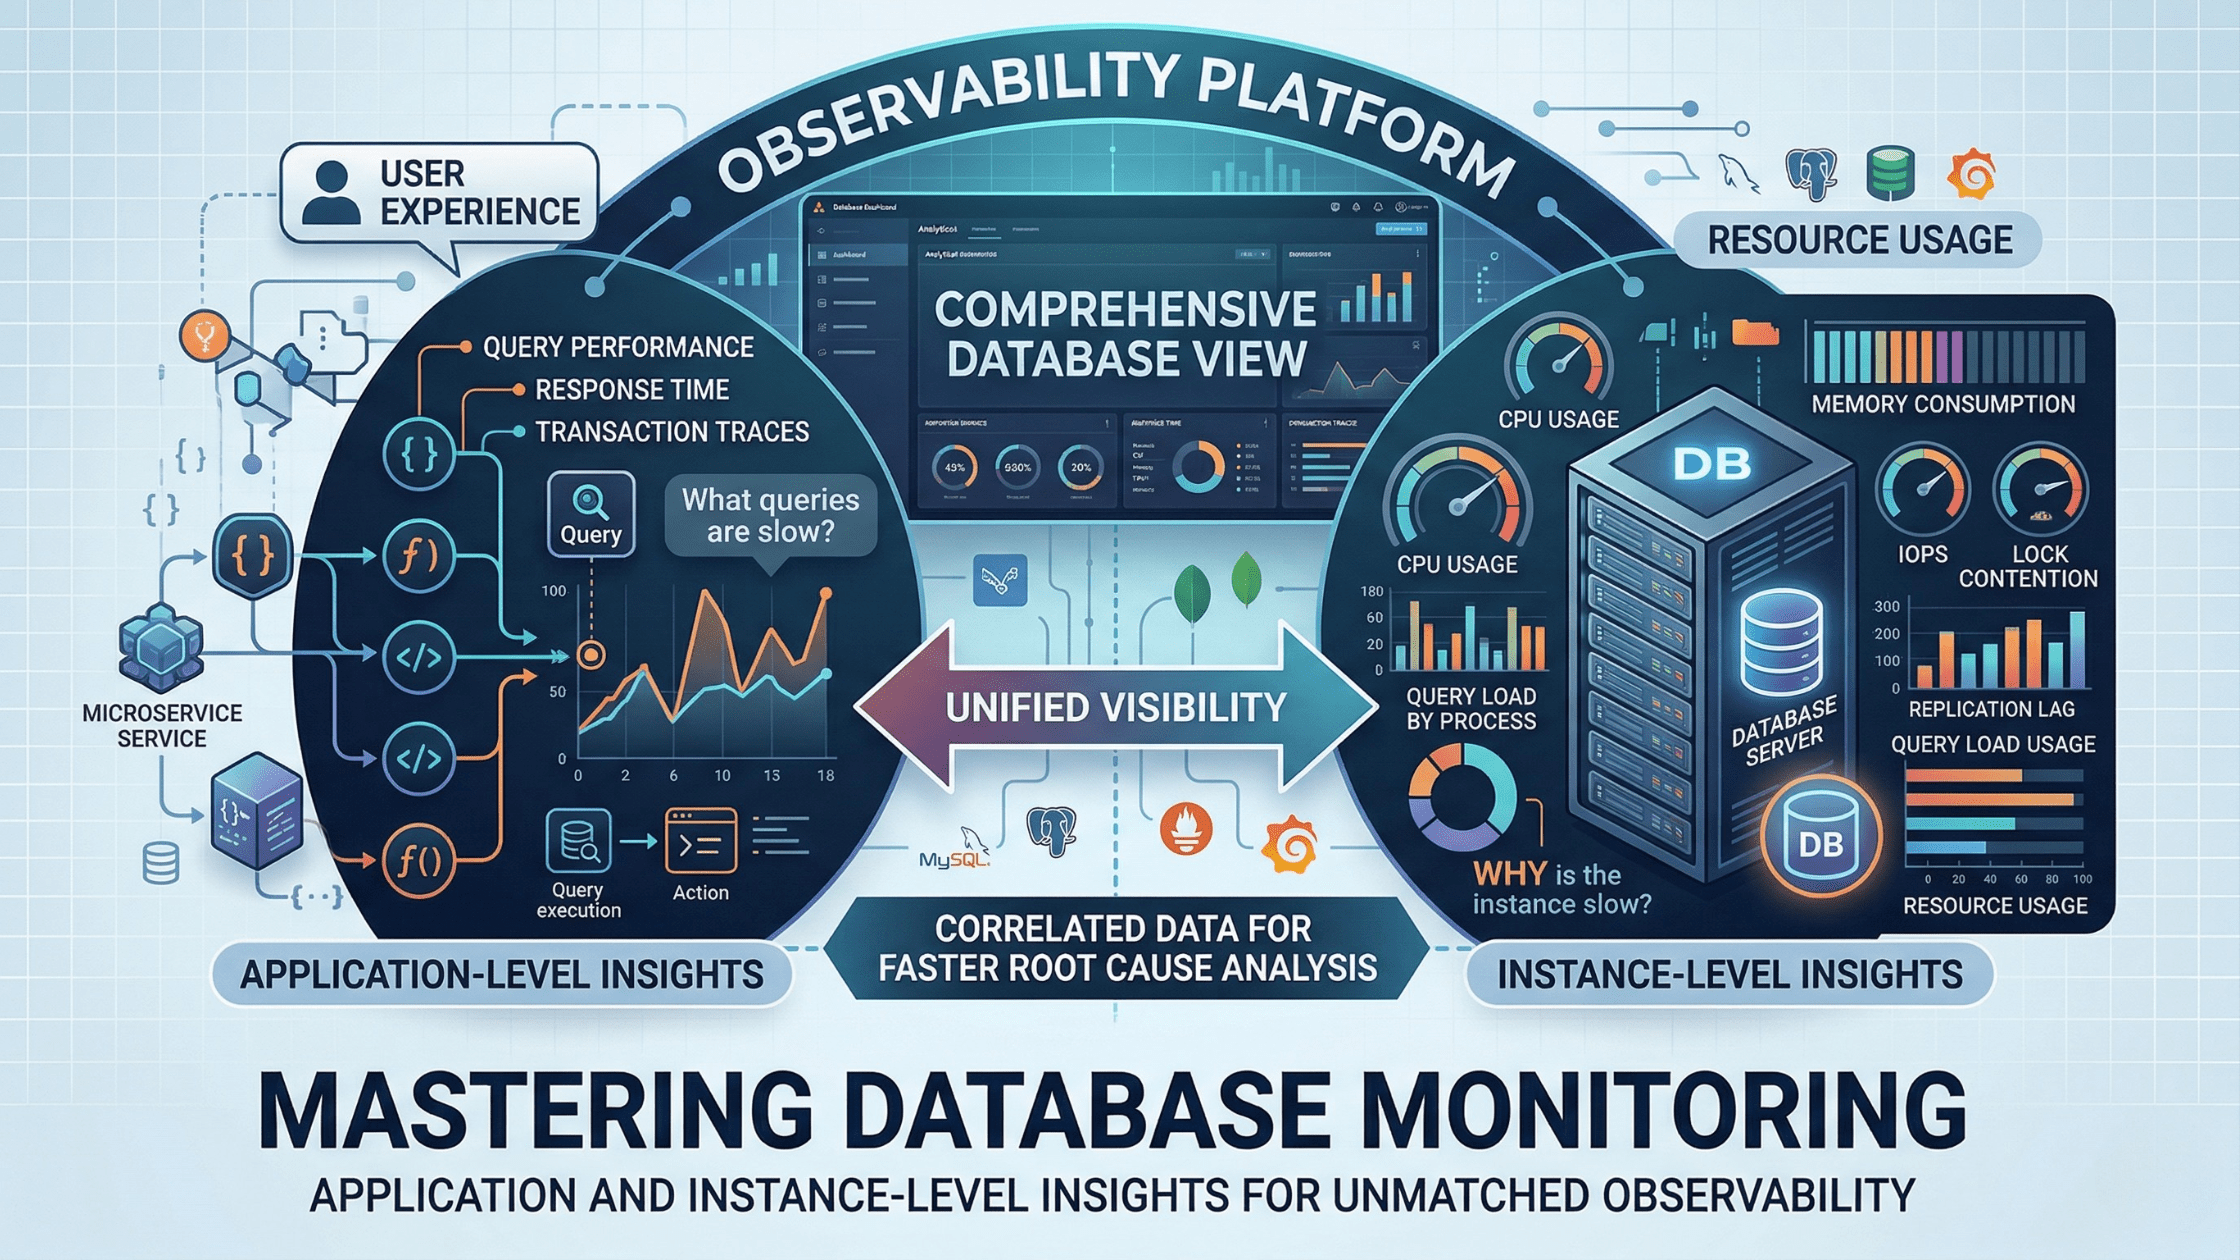
Database performance issues are among the most challenging problems in modern application environments. A slow query can cascade through your entire system, affecting user experience and business operations. Yet many organizations struggle with incomplete visibility into their database performance, relying … Read More
Blog Posts
Coming Soon | FusionReactor Product Update | Q2 2026
Your Instrumentation, Your Backend: The FusionReactor Agent Is Getting a Lot More Flexible FusionReactor has always offered something no other observability tool can match: deep, out-of-the-box instrumentation for ColdFusion applications. The kind of insight — CFML request transactions, query performance, … Read More

Evolving FusionReactor On-Premise Licensing for Greater Flexibility and Consistency
As part of our ongoing efforts to simplify and modernise FusionReactor, we’re introducing an update to the way on-premises licensing works. This change is designed to bring greater consistency across our platform, align with how many of our customers … Read More
Escaping Hotfix Hell: How FusionReactor Stops the Firefighting Cycle
Summary: FusionReactor is an APM and profiling tool for ColdFusion and Lucee CFML applications. It solves operational fragility in legacy systems by providing real-time heap profiling, transaction tracing, thread analysis, and deployment baselining — without requiring a runtime migration or … Read More
Cached ColdFusion Components: Elegant Pattern, Hidden Risk
Ben Nadel’s scoped proxy technique is clever architecture — but what happens when that shared state silently misbehaves at 2am? Here’s how to build the pattern with confidence. FusionReactor Team | March 2026 | 8 min read Note: This post … Read More
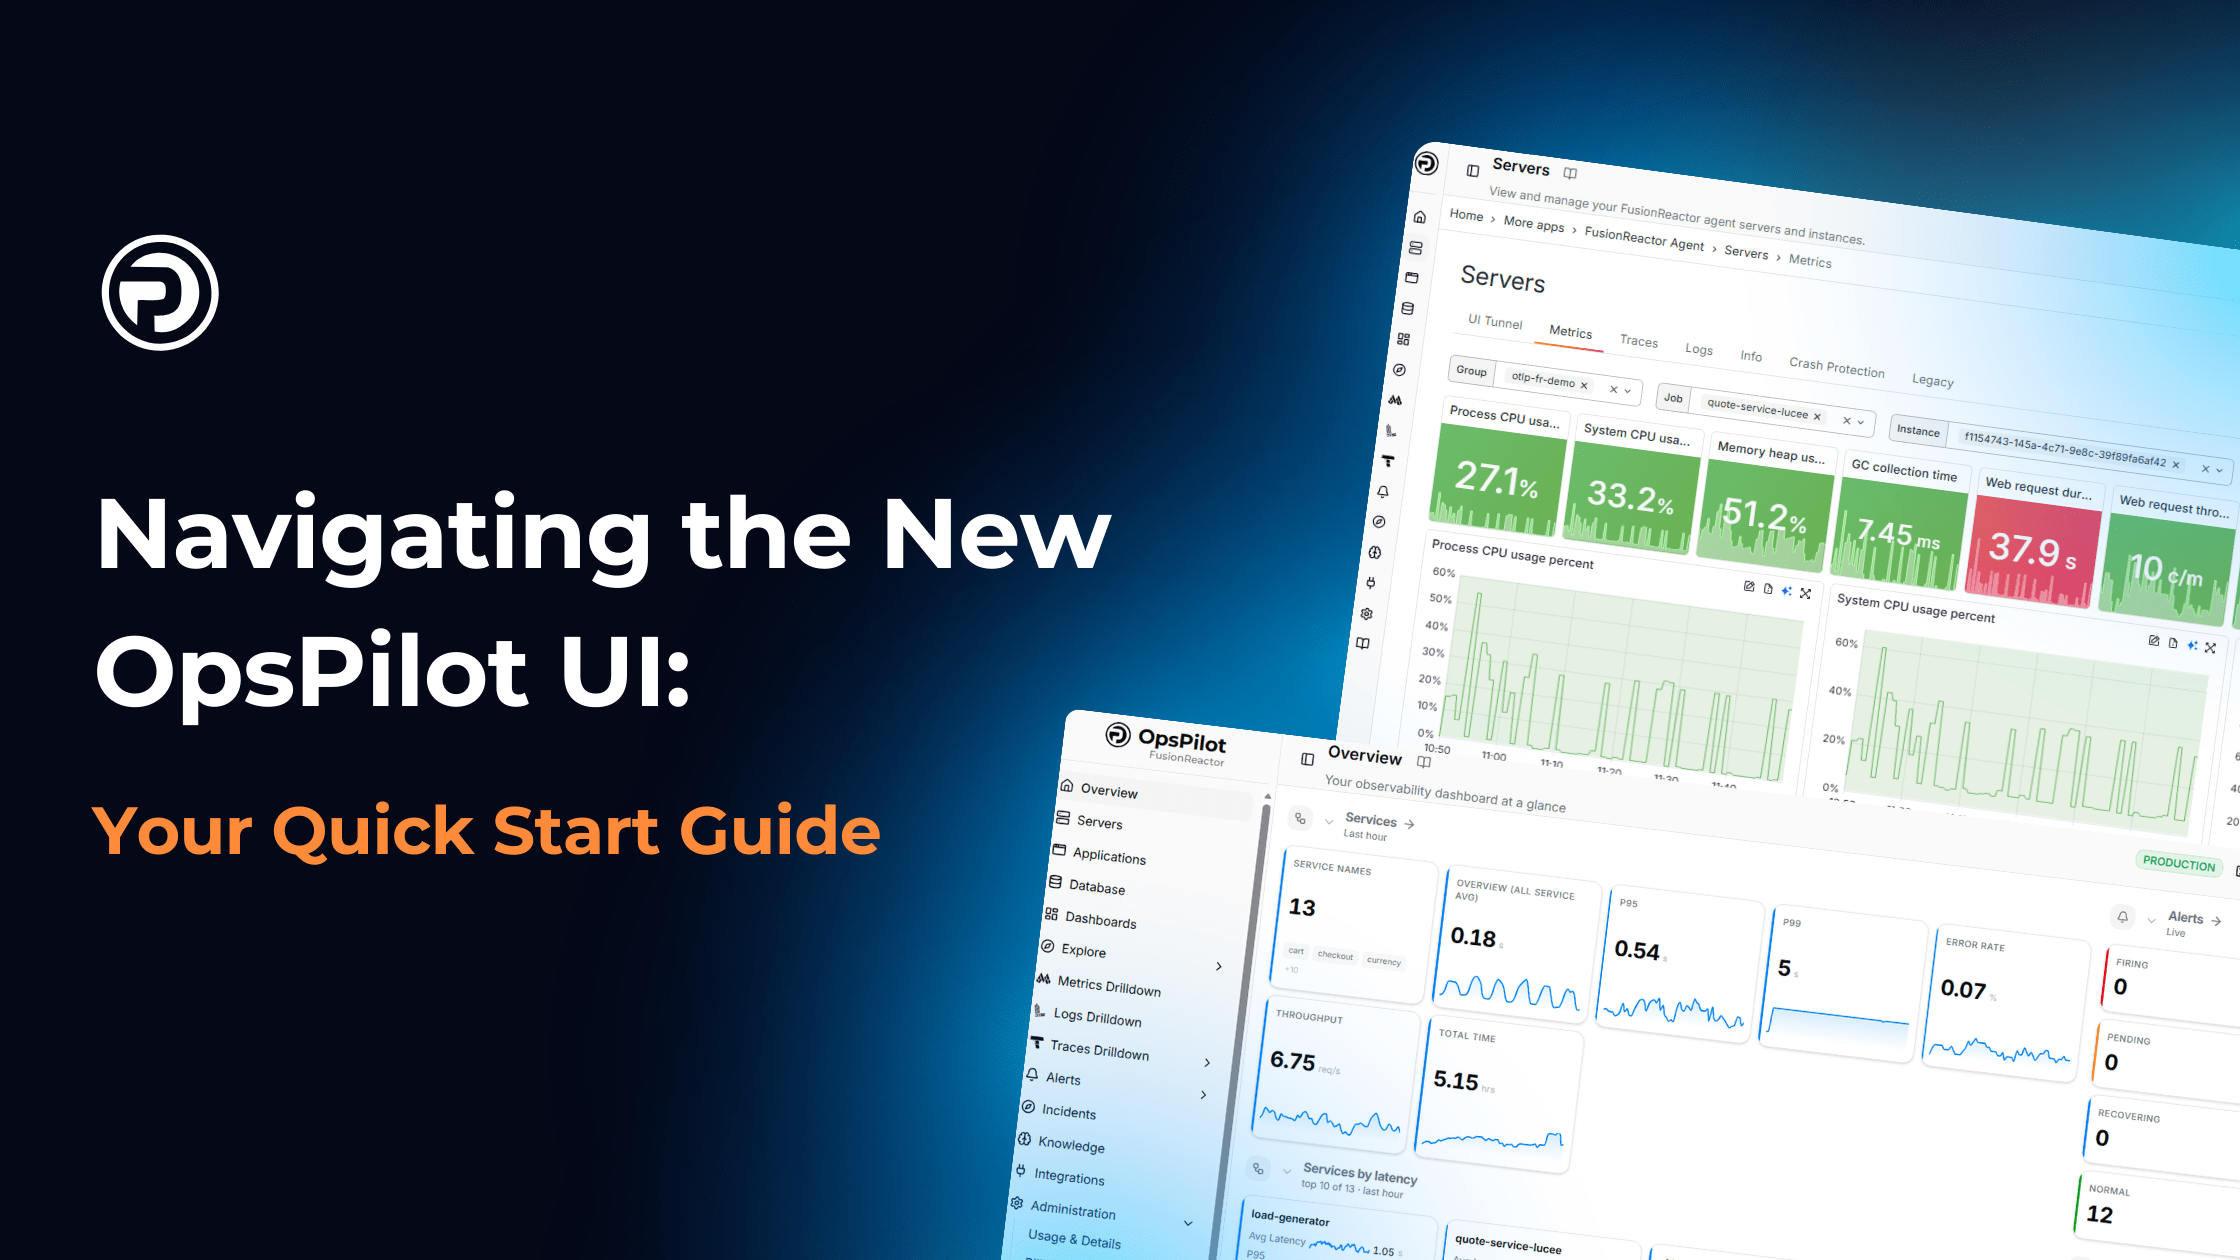
Navigating the New OpsPilot UI: Your Quick Start Guide
Change is good, but finding your favorite features in a brand-new interface can feel like looking for your keys in the dark. To help you get up to speed with the new OpsPilot UI, we’ve rounded up the most common … Read More
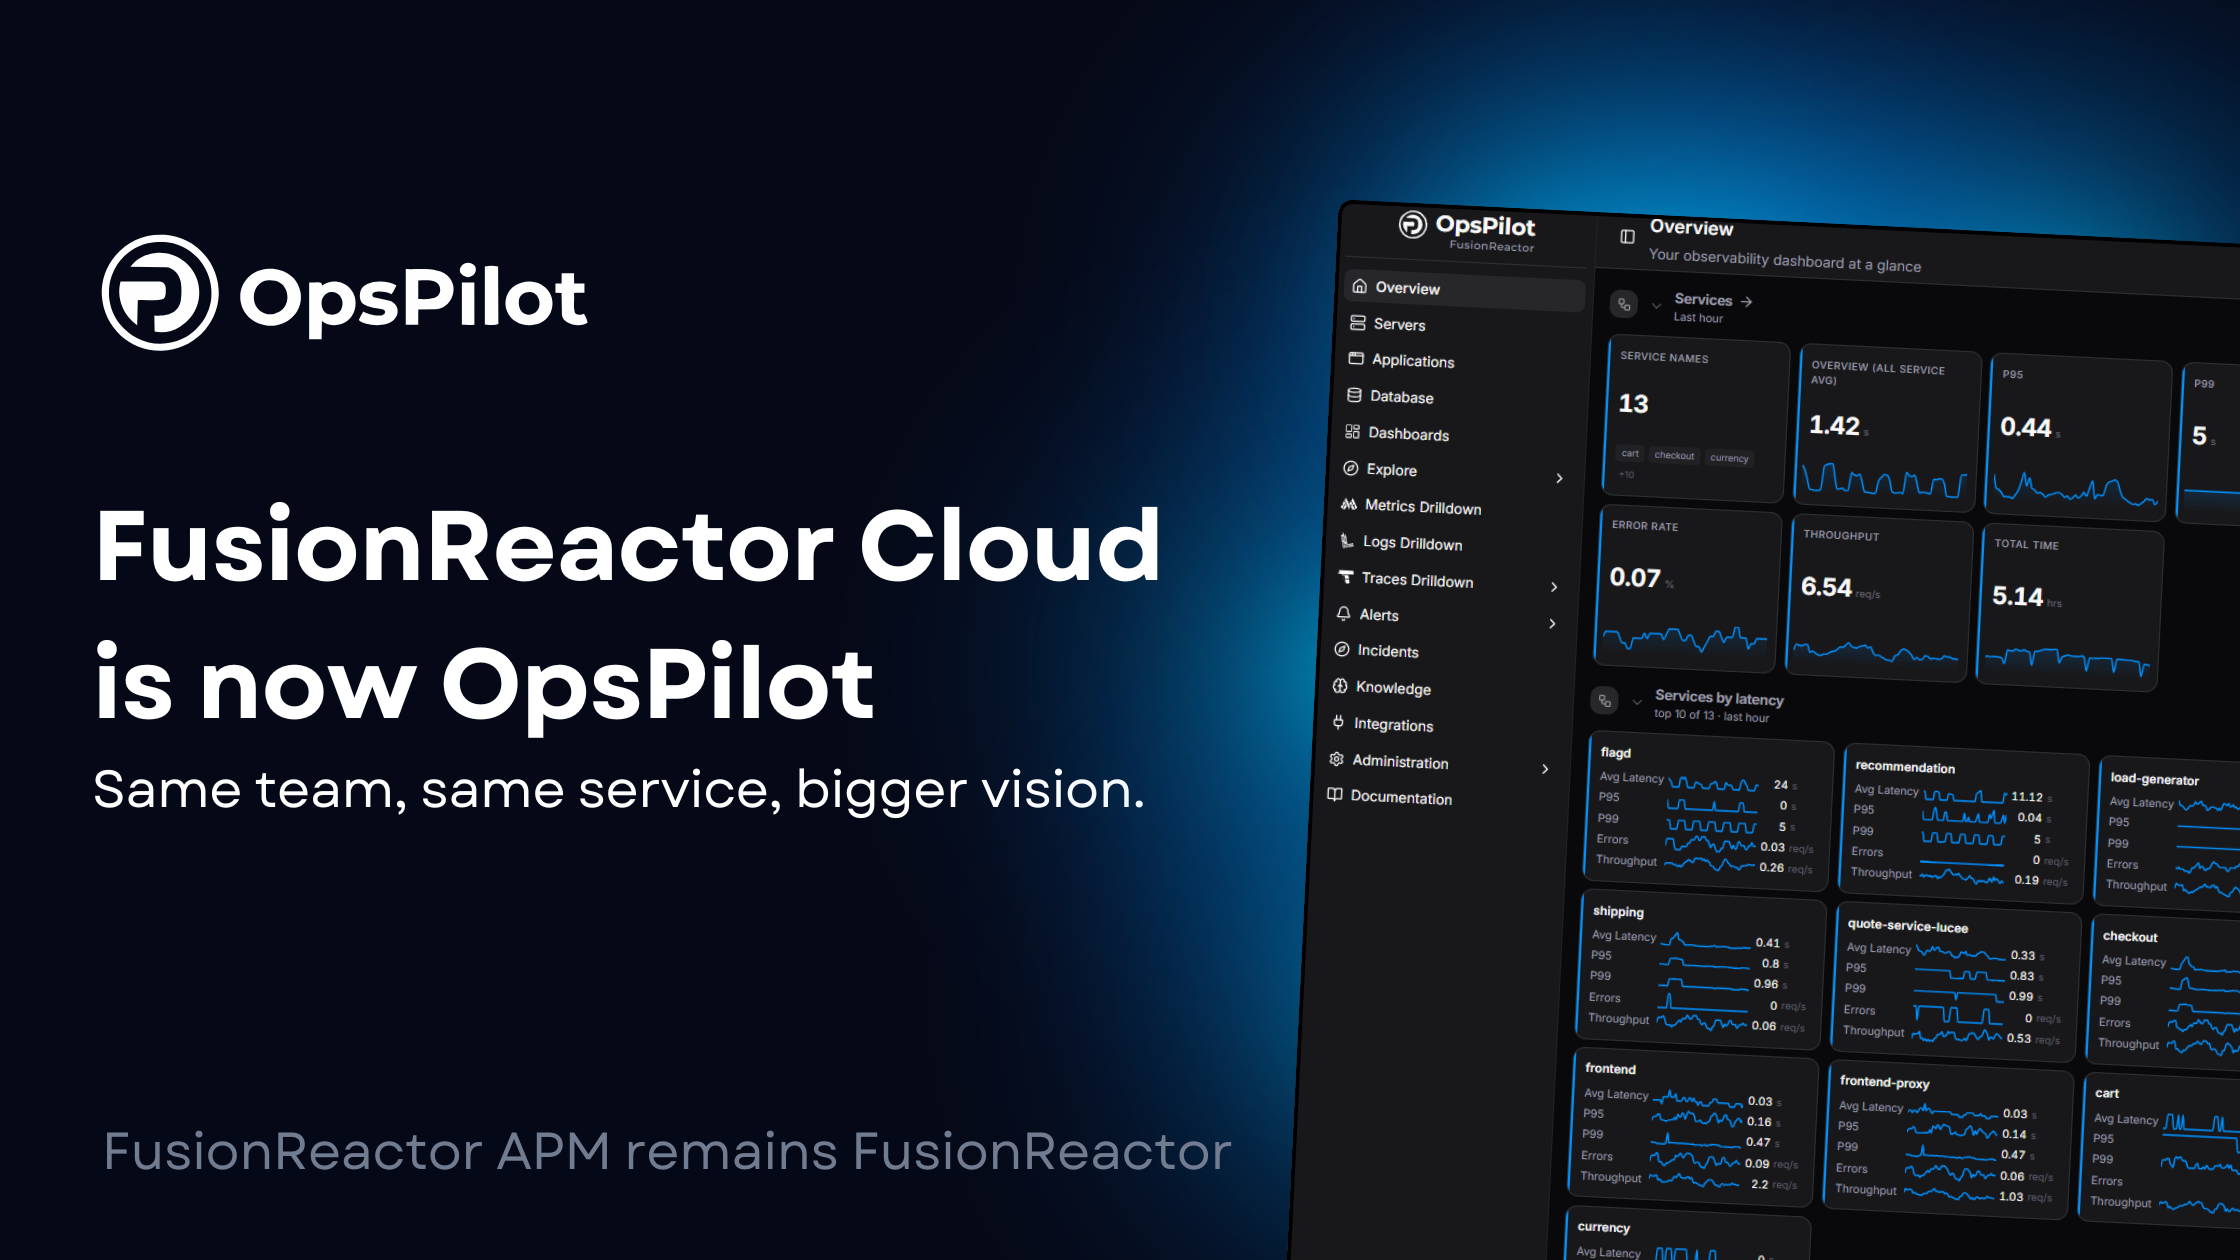
FusionReactor Cloud is Now OpsPilot
Same platform. Same team. Bigger vision. Today marks an important milestone for us: FusionReactor Cloud is officially becoming OpsPilot. Before anything else, we want to be absolutely clear about what this means. This rename only applies to FusionReactor Cloud.FusionReactor APM … Read More

The FusionReactor Take: Claude Sonnet 4.6
1. From “Experimental” to “Enterprise-Ready” Computer Use The most significant operational takeaway is the leap in OSWorld scores. For an Ops manager, “computer use” is the holy grail of automation. The Problem: Most legacy enterprise software lacks APIs. The Solution: … Read More

The FusionReactor Guide: Relocating CF ScriptSrc
Phase 1: Preparation & Migration Before touching the config, we need to ensure the physical assets are ready. Physical Move: Create your new directory (e.g., C:/cf_scripts). Sync Assets: Copy the contents from {cf_root}/cfusion/wwwroot/cf_scripts to the new location. Ops Tip: Use … Read More
OpenTelemetry Collector vs. Grafana Alloy: Which Should You Choose?
In the world of modern observability, the “Sorting Office” of your telemetry data is just as important as the data itself. Whether you are shipping traces, metrics, or logs to FusionReactor Cloud, you generally have two main choices: the industry-standard … Read More

FusionReactor Platform Comparison: Complete Observability Landscape Analysis
FusionReactor vs The Competition: Complete Observability Platform Analysis Data-driven comparison of FusionReactor against major observability platforms based on verified G2 user reviews across 10 satisfaction categories. Executive Summary We analyzed verified G2 user reviews comparing FusionReactor against seven major observability … Read More
FusionReactor Vs SolarWinds
FusionReactor vs SolarWinds APM: Application Monitoring Comparison Comparing FusionReactor and SolarWinds APM platforms based on verified G2 user reviews. See how support quality, ease of use, and overall satisfaction differ between these solutions. Infrastructure Monitoring Heritage vs. Purpose-Built APM SolarWinds … Read More

FusionReactor Vs Elastic APM
FusionReactor vs Elastic APM: Application Observability Comparison Comparing FusionReactor and Elastic APM observability platforms based on verified G2 user reviews. See how support quality, ease of use, and overall satisfaction differ between these solutions. Elastic Stack Extension vs. Integrated APM … Read More

FusionReactor vs Honeycomb
FusionReactor vs Honeycomb: Observability Platforms for Modern Applications Comparing FusionReactor and Honeycomb observability platforms based on verified G2 user reviews. See how support quality, ease of use, and overall satisfaction differ between these solutions. Modern Observability: Different Philosophies Honeycomb pioneered … Read More

FusionReactor Vs Grafana
FusionReactor vs Grafana Labs: Observability Platform Comparison Comparing FusionReactor and Grafana Labs observability platforms based on verified G2 user reviews. See how support quality, ease of use, and overall satisfaction differ between these solutions. Grafana Included + Full LGTM Stack … Read More
FusionReactor Vs Sentry
FusionReactor vs Sentry: Application Monitoring Platforms Compared Comparing FusionReactor and Sentry error monitoring and observability platforms based on verified G2 user reviews. See how support quality, ease of use, and overall satisfaction stack up between these solutions. Error Monitoring vs. … Read More
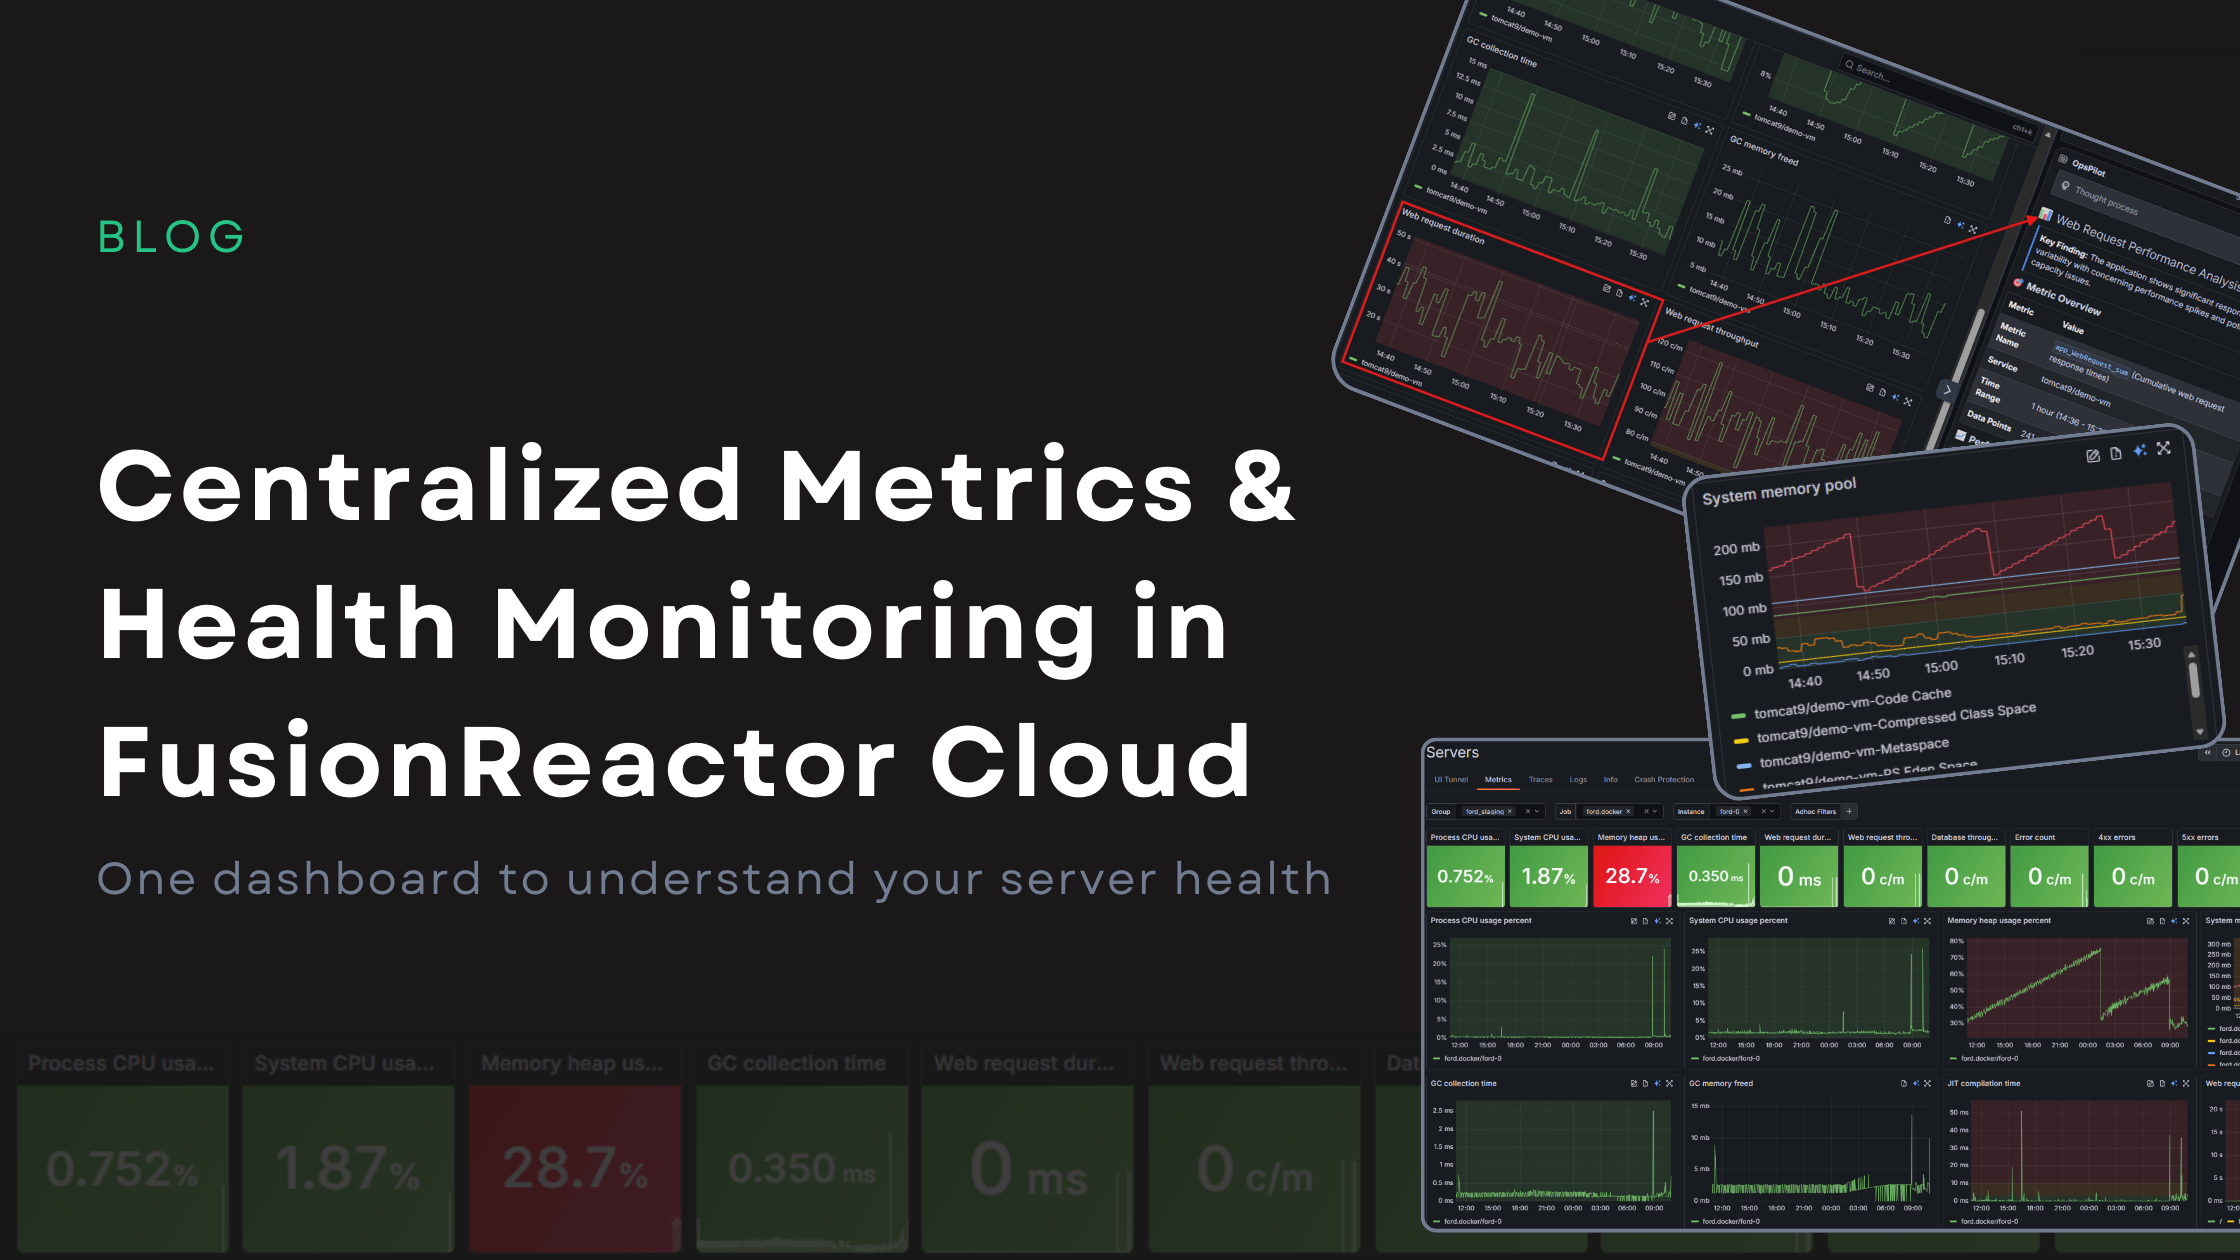
Centralized Metrics and Health Monitoring in FusionReactor Cloud
Centralized Metrics: One Dashboard for Complete Server Health in FusionReactor Cloud Metrics are only useful if they help you take action. FusionReactor Cloud’s new Centralized Metrics Viewer turns raw monitoring data into clear, meaningful visual indicators, making it easy to … Read More
FusionReactor Vs New Relic
FusionReactor vs New Relic: Observability Platform Comparison Based on Real User Reviews Comparing FusionReactor and New Relic observability platforms based on verified G2 user reviews. See how support quality, implementation speed, and ease of use stack up between these solutions. … Read More
FusionReactor Vs Splunk
FusionReactor vs Splunk: Which Observability Platform Delivers Better User Experience? Comparing FusionReactor and Splunk observability platforms based on verified G2 user reviews. See how deployment speed, support quality, and ease of use differ between these solutions. The Observability Platform Decision … Read More

FusionReactor VS Dynatrace
FusionReactor vs Dynatrace: Real User Reviews Reveal the Hidden Cost of Enterprise Observability Comparing FusionReactor and Dynatrace Observability solutions based on verified G2 user reviews. See how user satisfaction, ease of use, and support quality stack up between platforms. The … Read More
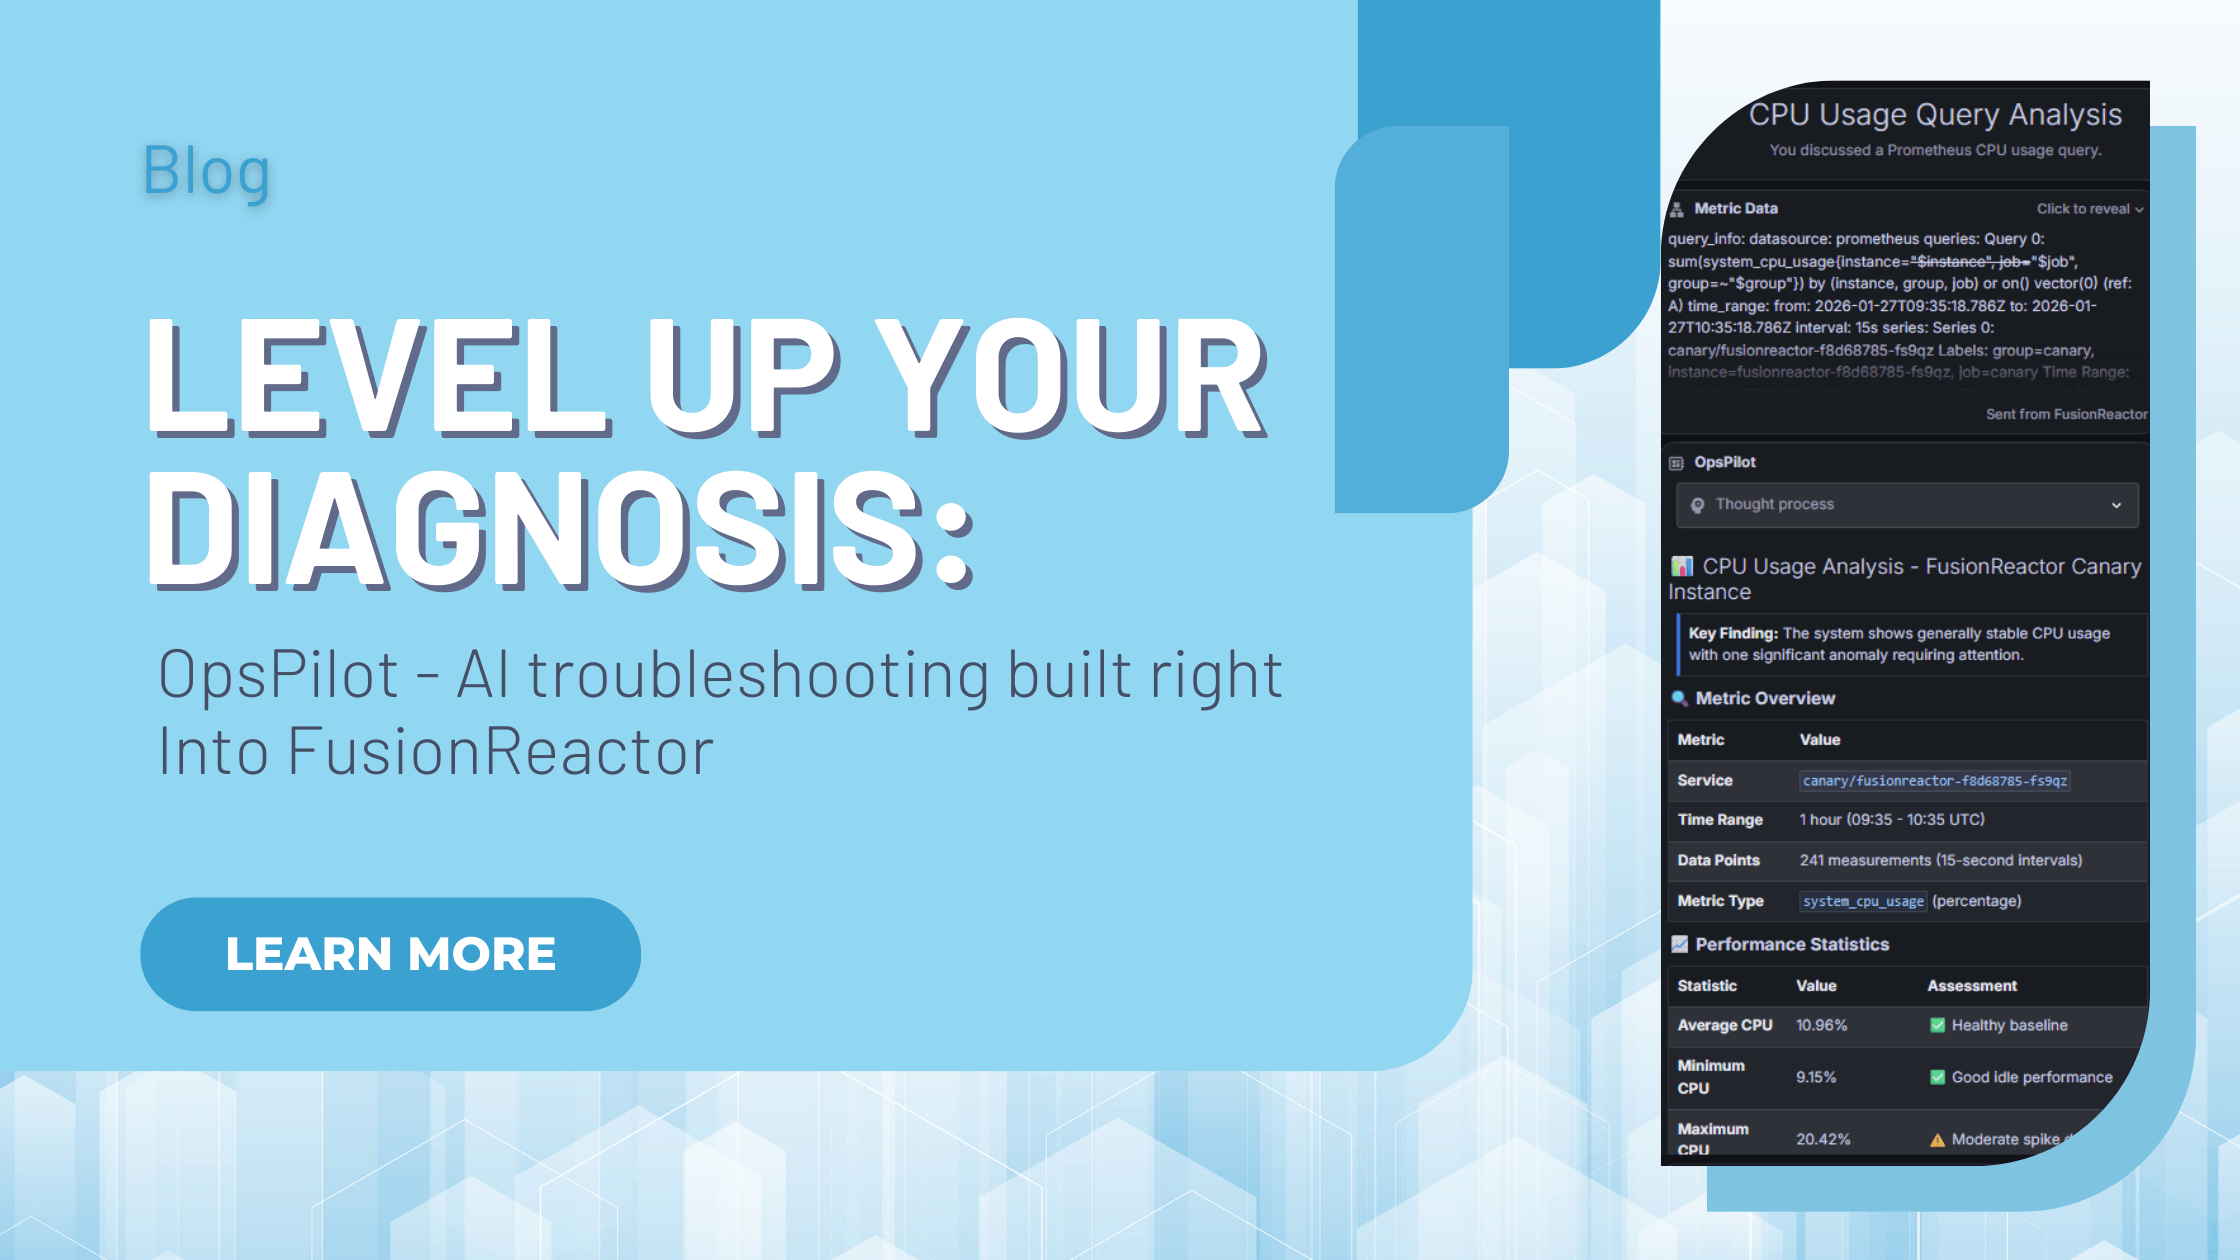
OpsPilot: AI Troubleshooting & Root Cause Analysis Built Into FusionReactor Cloud
FusionReactor Cloud offers powerful AI troubleshooting, designed not just to show you what went wrong, but also to immediately help you understand the “why” and move straight to the fix. With OpsPilot, FusionReactor’s revolutionary AI assistant, artificial intelligence is no longer … Read More
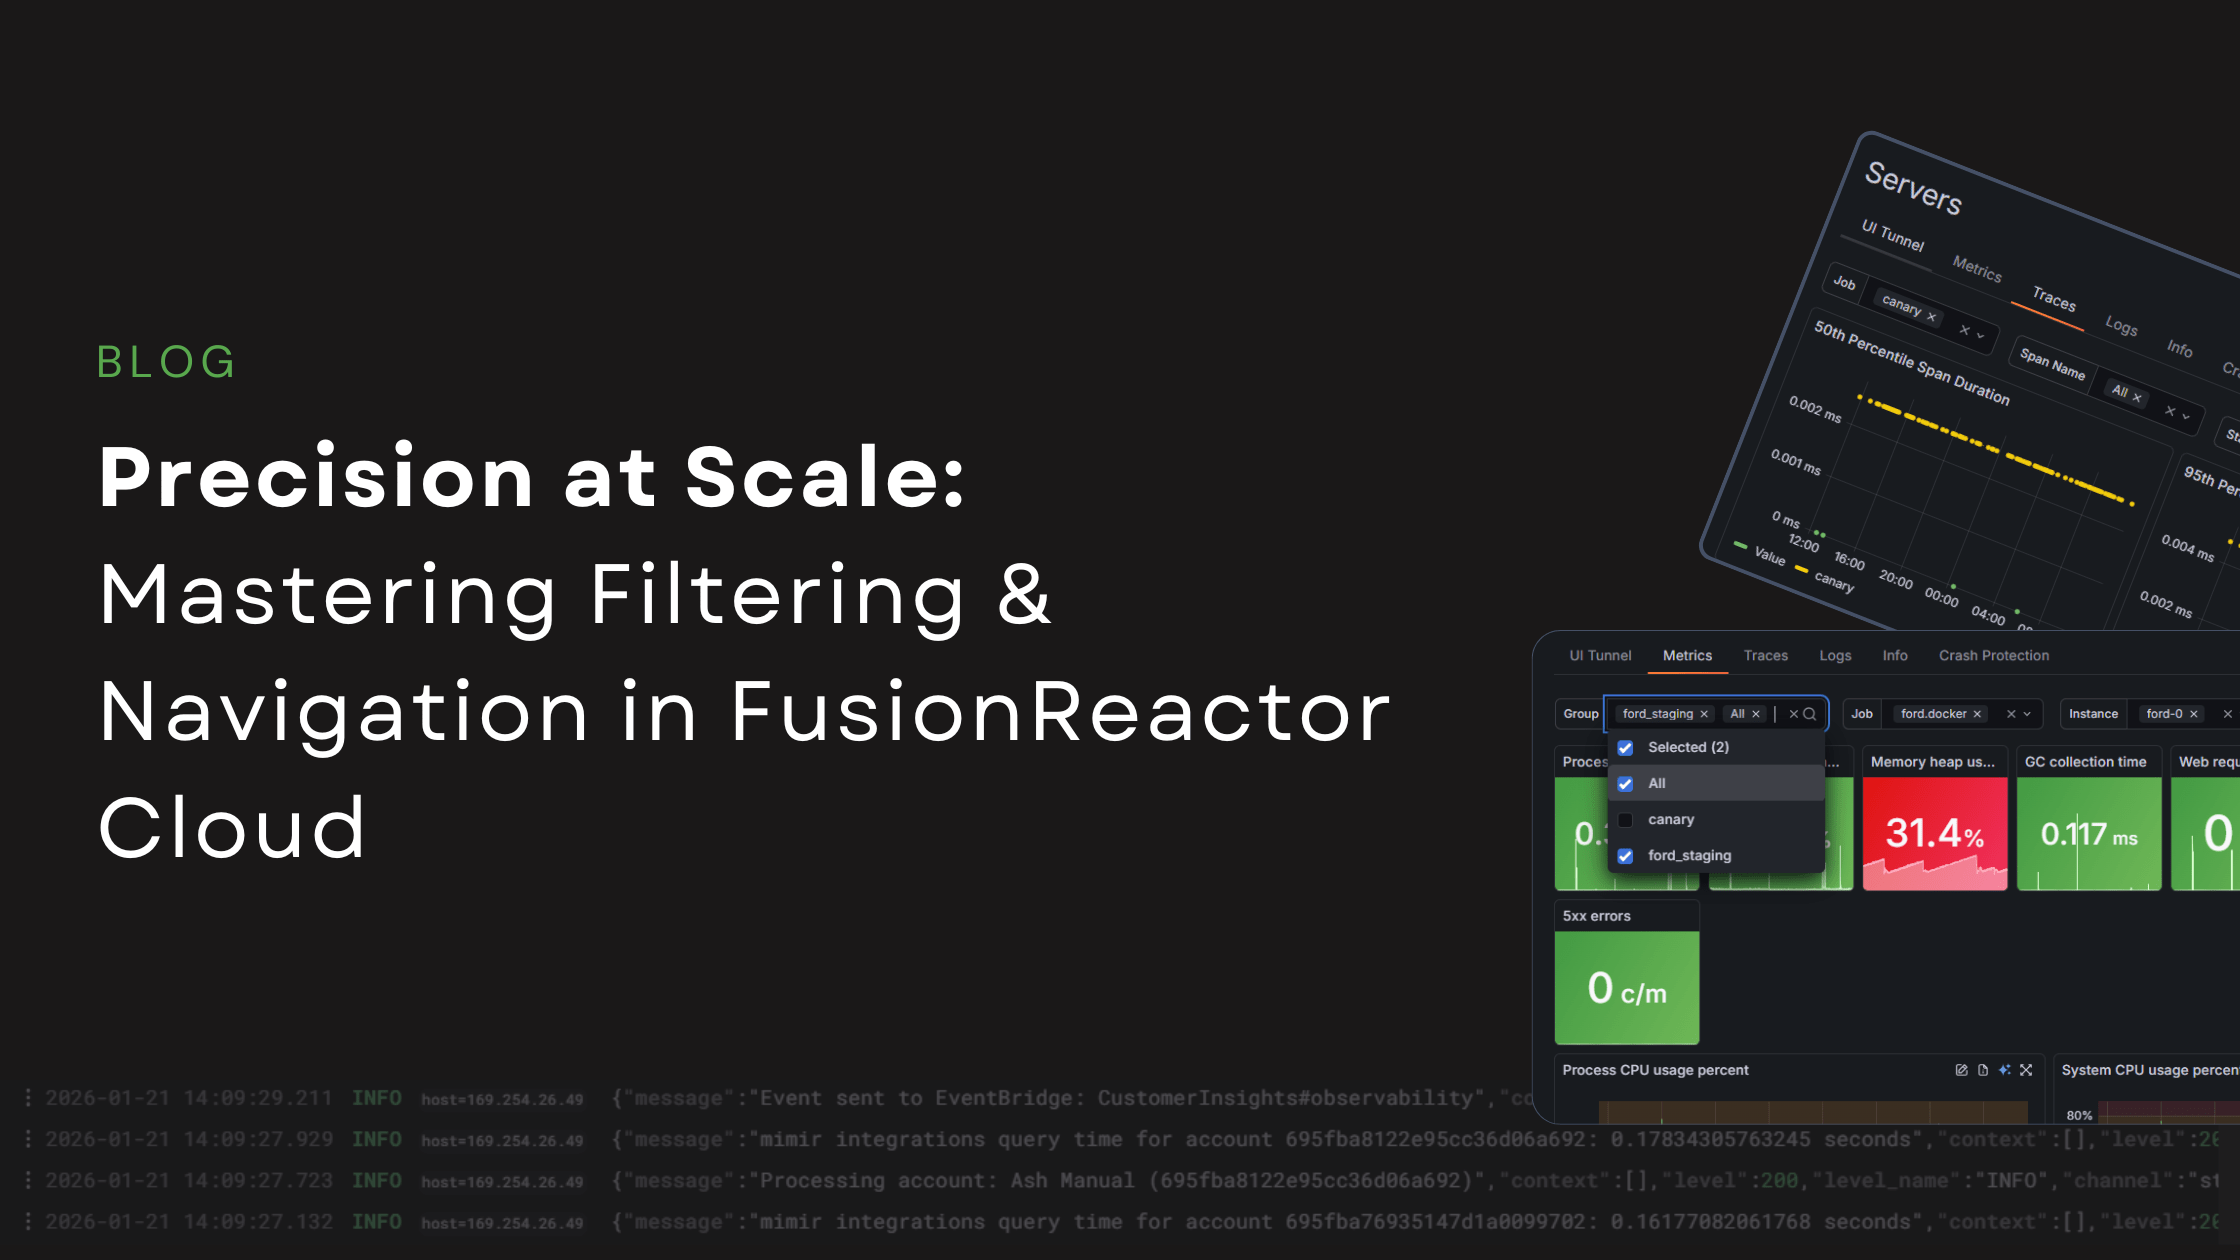
Precision at Scale: Mastering Filtering and Navigation in FusionReactor Cloud
When you are managing a handful of servers, navigation is simple. However, when your environment scales to dozens or even hundreds of instances, that simplicity collapses into chaos without the right architecture. FusionReactor Cloud’s new server experience is built from … Read More
Why OTLP Is Becoming the Universal Language of Observability
In the past, every monitoring tool (like Datadog or New Relic) had its own “language.” If you wanted to switch tools, you had to rewrite your code. OTLP is a universal language for your app’s data. It allows you to: … Read More

Two Game-Changing Features Now Available to All FusionReactor Cloud Users
We have exciting news for the FusionReactor community: as of January 12, 2026, Anomaly Detection and Custom Dashboards are now available to all FusionReactor Cloud users across every plan tier. These powerful observability capabilities, previously exclusive to higher-tier plans, are … Read More
OpenTelemetry Collector v1.49.0/v0.143.0: What’s New in January 2026
The OpenTelemetry community has released version 1.49.0/v0.143.0 of the OpenTelemetry Collector on January 5-6, 2026, bringing significant updates to the world’s most popular open-source observability framework. As OpenTelemetry continues its rapid adoption—with 48.5% of organizations already using it and another … Read More

Beyond the Three Pillars: Why Unified Telemetry is the Backbone of AI Observability
For years, the observability world has worshipped at the altar of the “Three Pillars”: Metrics, Logs, and Traces. But let’s be honest: in the heat of a production outage, these pillars often feel more like silos. You see a latency … Read More
How AI-Powered Observability Solved a Complex Microservices Mystery in Minutes
AI Observability Tool Finds Root Causes in Minutes | OpsPilot Tutorial 12 minute read How AI-Powered Observability Solved a Complex Microservices Mystery in Minutes When production breaks at 3 AM, every second counts. See how OpsPilot AI reduced troubleshooting time … Read More


