Modern systems don’t fail on a schedule. Performance issues, restarts, and outages occur in real time, often without warning. That’s why the new Servers experience in FusionReactor Cloud gives you a potent combination: live observability seamlessly fused with deep historical insight, all within a single view.
With the new server cubes interface, you can instantly see the health of every server as it is happening—or smoothly rewind time to understand precisely what went wrong hours or even weeks earlier.
This isn’t just an update; it’s a fundamental shift in how you experience your operational data. Let’s explore what’s new and why this dual perspective is non-negotiable for modern operations.
The Unblinking Eye: Live Mode & Instant Insight
Your operations dashboard should reflect reality, not a delayed snapshot. That’s the principle behind the new Servers view, which now updates continuously, giving you a real-time view of your entire fleet.
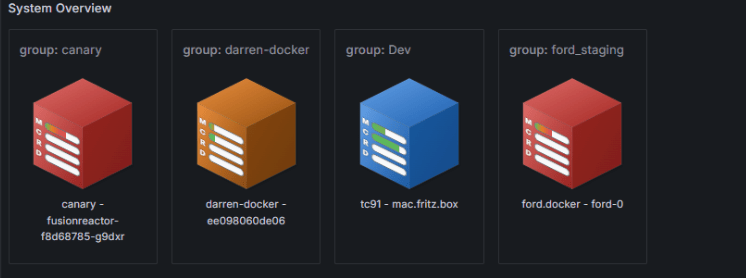
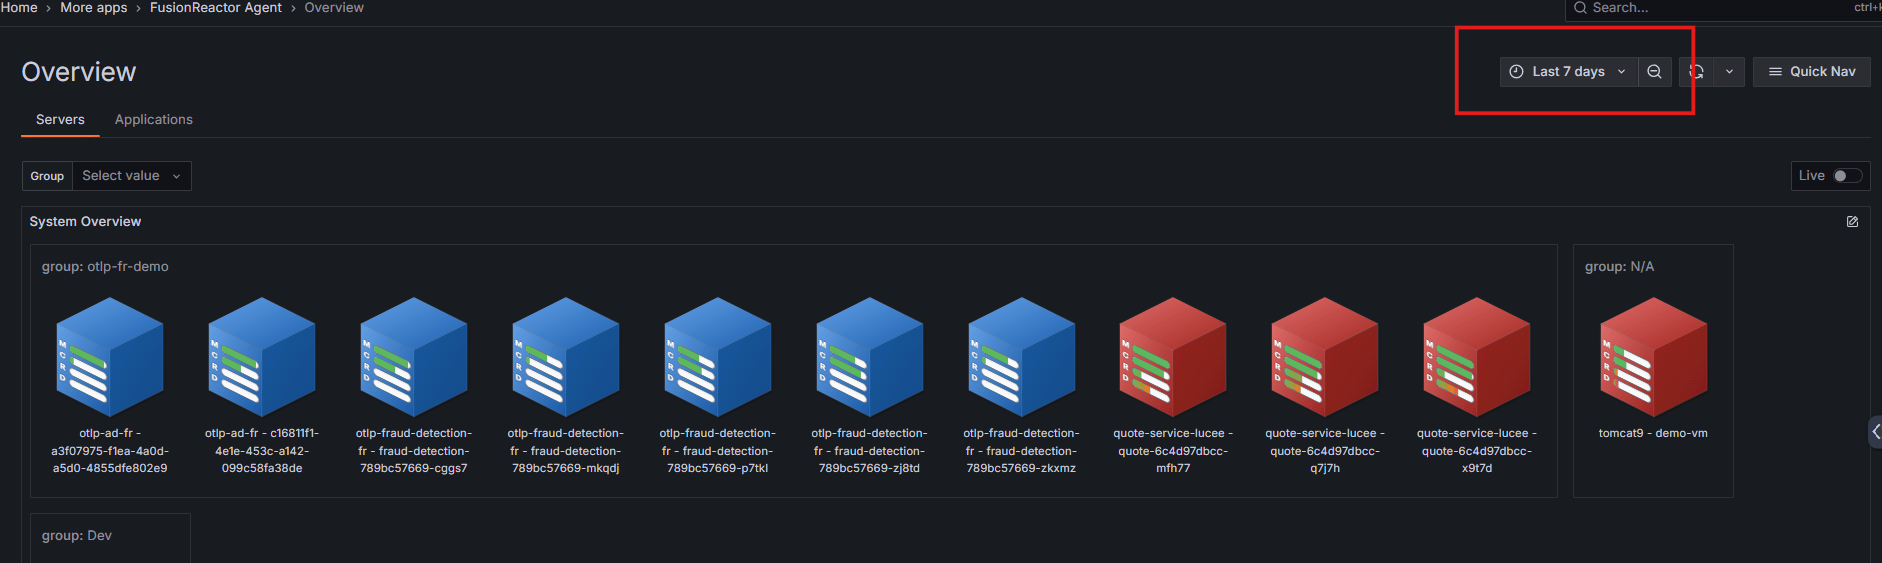
The servers are represented by intuitive, color-coded cubes, instantly conveying their current status:
- Blue: Everything is running smoothly.
- Orange: A performance warning needs attention.
- Red: A critical error state requires immediate action.
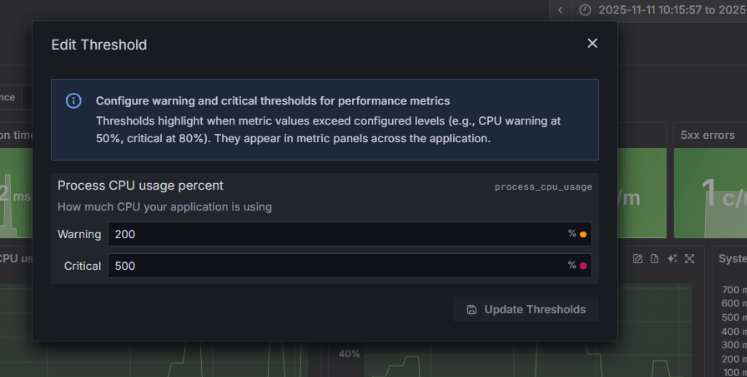
⚙️ Configurable Thresholds for Precision
Crucially, the thresholds that determine when a cube changes from Blue to Orange or Red are now fully configurable. You can tailor the alerts to your application’s unique performance requirements, making the visual status immediately relevant to your operational goals.
As soon as an incident occurs—a service stalls, an exception spikes, or a server becomes unavailable—the visual state changes instantly. There’s no refresh button to click, and no need to wait for delayed metrics. This unparalleled immediacy lets you spot incidents the moment they occur, validate your fixes instantly, and watch deployments and restarts unfold in a dynamic, real-time environment.
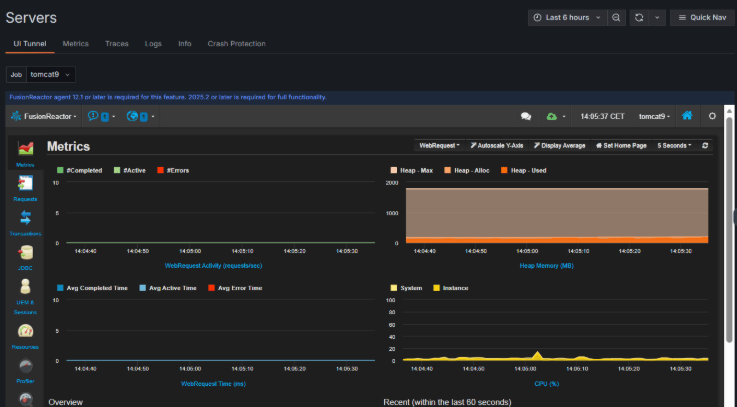
🔭 The Tunnel: Viewing Live Data with AI
To complement this view, you can use The Tunnel to dive even deeper. The Tunnel can be used to view live data from your application servers and includes AI to analyze the data stream, highlighting anomalies in real time.
Rewind Time: Historical Analysis at Your Fingertips
Live data tells you what’s happening now, but you can’t fix a recurring problem without understanding its history.
With a single toggle, you can switch off the live feed and move directly into historical analysis mode. The transition is seamless: a dedicated time picker appears, allowing you to explore activity across a custom range.
Need to investigate a service failure overnight? Want to pinpoint when performance degradation first started last week? Simply choose your time window, and FusionReactor Cloud instantly renders server states exactly as they were during that period.
Solving the Visibility Gap: Seeing Servers that Disappeared
One of the most valuable and often underrated improvements lies in how the historical mode handles offline servers.
If a server was online at any point within your selected time window, it will appear in the view—even if it is currently shut down.
This solves a critical visibility gap that often plagues complex environments. There is:
- No more guessing if a retired or restarted service ever existed.
- No more “missing” servers when reviewing an outage.
If a service is spun up, fails, restarts, or disappears, you will now see its full lifecycle.
Transforming Data into Operational Stories
When you view history, you don’t just see static data; you see the behavior of your infrastructure. You’ll notice servers that appear and disappear, color changes that correlate precisely to failures, and patterns of instability that indicate underlying issues.
This visual storytelling immediately exposes key operational events:
- Rolling restarts of services during a deployment.
- Duplicate services spun up after a partial failure.
- The exact duration and intensity of a performance bottleneck.
One Interface for “Now” and “Then”
For Operations Teams, the greatest benefit is the unified experience. You no longer need to jump between separate live monitoring tools and historical reporting platforms.
FusionReactor Cloud delivers both side by side: one dashboard, one timeline, one consistent view of reality.
Whether you are reacting to an outage in real time or preparing a detailed post-mortem report, everything you need to monitor, audit, and investigate with confidence is instantly available.
What’s Next?
In the next post in this series, we’ll cover how to filter and navigate your servers at scale, so you can find exactly what you’re looking for in seconds—even in large, noisy environments.