When you are managing a handful of servers, navigation is simple. However, when your environment scales to dozens or even hundreds of instances, that simplicity collapses into chaos without the right architecture.
FusionReactor Cloud’s new server experience is built from the ground up to handle that scale. The updated design introduces a powerful, seamless flow that lets you move effortlessly from a global fleet view to the deep diagnostics of a single server. This allows you to work without losing context or interrupting your investigation.
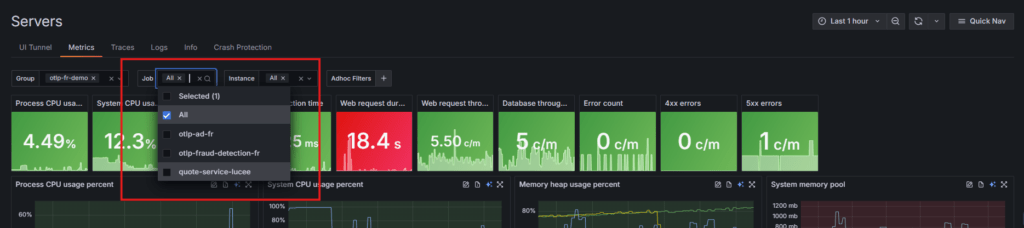
Organize the Chaos: Group-Based Filtering Made Simple
Every operational team structures its systems differently: by environment, by service, or by business domain. FusionReactor Cloud adapts to your unique structure using server groups.
With a simple selection, you can instantly narrow your view to focus only on the servers that matter at that moment. This cuts through the noise of your entire infrastructure. Imagine instantly segmenting your fleet to focus on:
- The Development environment during a testing cycle.
- A specific Functional Service Cluster that is experiencing latency.
- All instances belong to a particular individual application.
This filtering power is more than just a convenience; it is a critical mechanism for reducing noise, improving focus, and dramatically speeding up the initial stages of any investigation.
Here is how these new tools allow you to find the needle in the haystack instantly.
From Fleet to Focus: One-Click Navigation
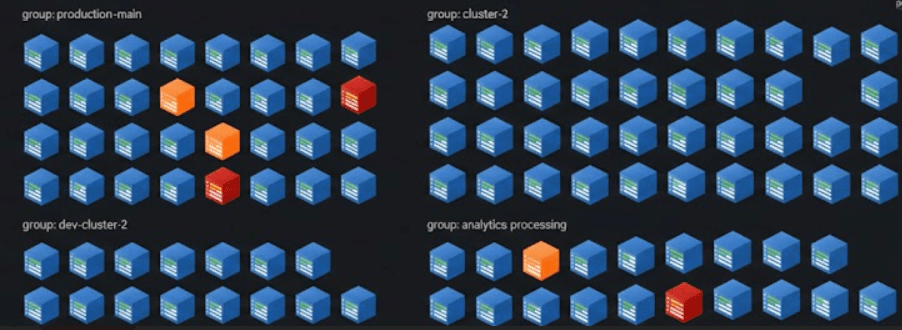
The beauty of the new server cube interface is that it moves you from the macro view to the micro view in a single, fluid action.
Each server cube is more than a health indicator; it is an active gateway. Click a cube to instantly open the detailed diagnostic view for that server. From there, you can access Metrics, Traces, Logs, Crash Protection, and OpsPilot integrations.
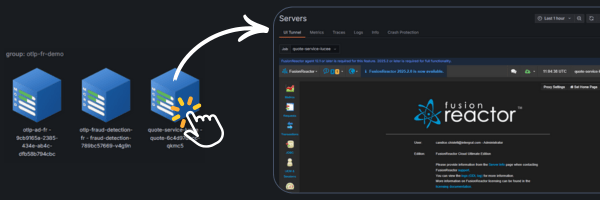
The user interface is optimized for minimum friction. You do not need to search for server names or navigate through multiple layers of menus. You move from the fleet overview to deep, actionable details in one decisive action.
Bringing the Servers to You: Context-Aware Multi-Instance Views
The old model forced you to analyze data one server at a time, requiring constant switching and mental context juggling. The new approach reverses this: instead of hopping between servers, you bring the server data to your current view.
You can now examine metrics, logs, and traces across multiple servers simultaneously by adjusting your filters. This capability is transformative for comparative analysis:
- Compare the performance of multiple services running on the same host.
- View all Production server charts side-by-side on a single screen.
- Identify outliers by identifying which service is spiking CPU or memory usage.
You gain a consolidated perspective that lets you analyze and compare data across your entire environment without ever leaving the page you are on.
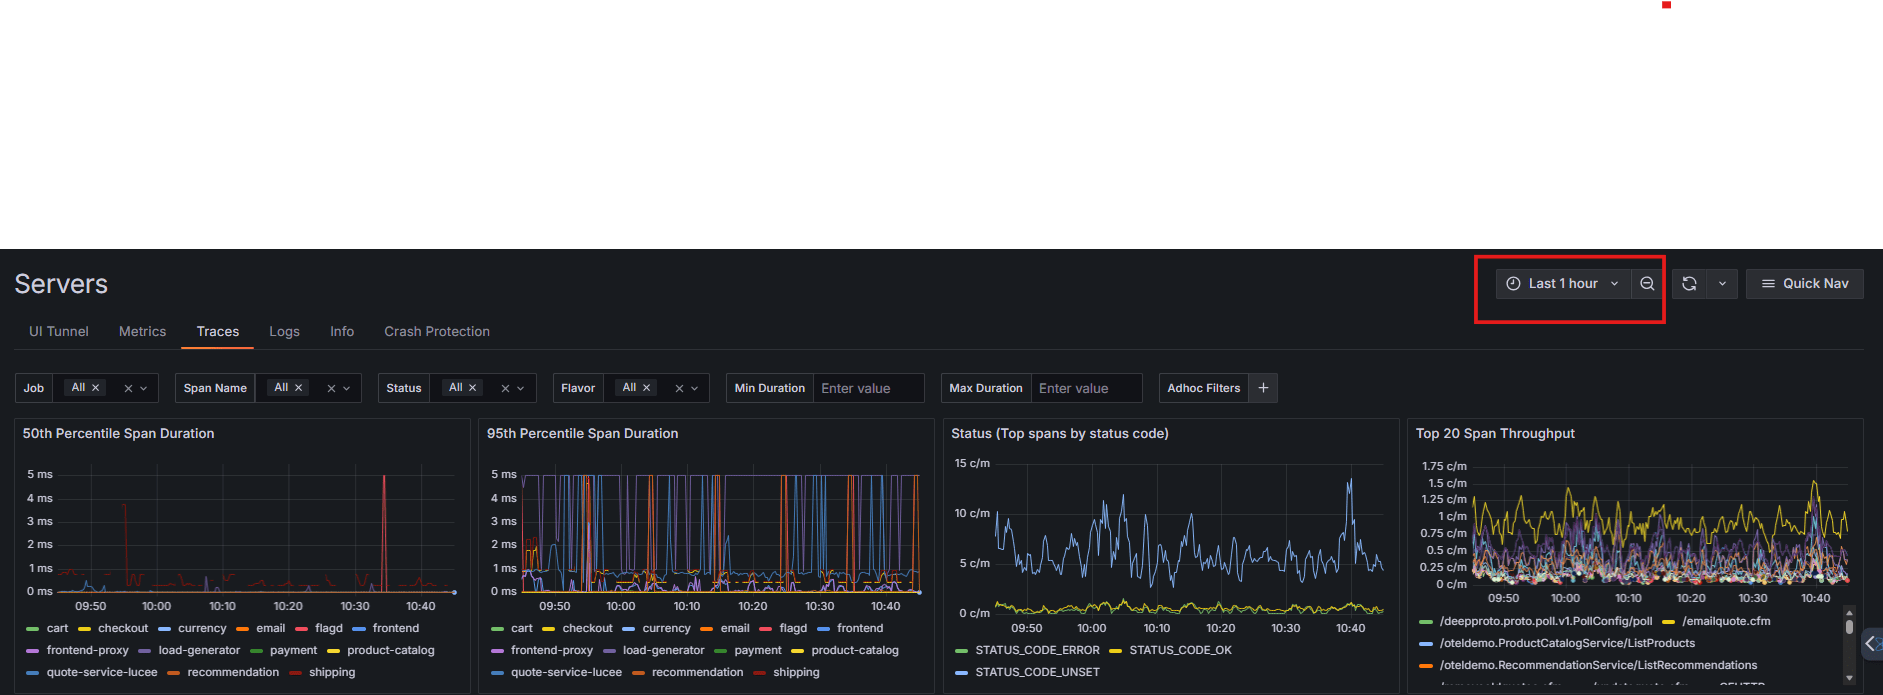
The Power of Persistence: Context That Follows You
During a critical investigation, losing your context is a catastrophe. FusionReactor Cloud eliminates this risk by ensuring your chosen view settings persist automatically.
Your selected timeframe, filters, and specific instances all remain locked in place as you navigate between the Metrics, Traces, and Logs tabs. This means you are constantly focused on the investigation rather than repetitive setup or fighting against accidental resets.
Scaling Without Sacrifice: Designed for Speed
Many monitoring tools begin to strain as environments grow. More servers often mean more noise and more friction. FusionReactor Cloud is designed to do the opposite.
The larger your infrastructure, the more valuable these dynamic features become. Global filtering makes it simple to isolate problems in large systems, while multi-instance views provide the necessary bird’s-eye perspective.
The entire interface is built for speed and clarity. It scales with your infrastructure so you can spend your time diagnosing problems, not fighting the tool.
What’s Next?
In the next part of this series, we will dive into a major innovation: OpsPilot integration across errors, profiles, JDBC, traces, and crash protection. We will explore how AI is now embedded directly into your diagnostic workflow.