FusionReactor Cloud offers powerful AI troubleshooting, designed not just to show you what went wrong, but also to immediately help you understand the “why” and move straight to the fix.
With OpsPilot, FusionReactor’s revolutionary AI assistant, artificial intelligence is no longer a side project or a separate tool. It is your trusted coworker, an integral part of your daily workflow, embedded directly where the data lives. Instead of spending hours hunting through stack traces, logs, and profiles, you can now simply ask your AI partner to interpret the problem for you.
This is AI built by engineers, for engineers. Get ready to move faster than ever before with a digital teammate that always has your back.
What Makes OpsPilot Your New Best Friend?
OpsPilot is the internal AI engine that analyzes your application data in real time. It does not just read data; it understands context across your entire application ecosystem. Think of it as the colleague who has read every log and remembers every trace.
| OpsPilot Understands | OpsPilot Delivers |
|---|---|
| Errors, SQL statements, Traces, and Profiles | Root Cause Analysis and Explanations |
| Logs, Crash Protection Events, and Runtime Behavior | Optimization Recommendations and Guidance |
It turns complex, raw data into actionable insights without leaving the product. There are no external integrations and no extra tools: just pure, immediate analysis.
One Click from Chaos to Clarity
Think back to the old troubleshooting routine: reading endless stack traces, searching through logs, guessing at causes, and running tests. That time is gone. Now, all you need to do is click Ask OpsPilot.
Directly from the error view, you can send the full failure context to your AI coworker, who swiftly:
- Interprets the error message and identifies potential root causes.
- Explains the problem in clear, plain language.
- Suggests immediate optimizations or next steps.
It is like instantly equipping every developer on your team with an on-demand, expert performance engineer.
AI Troubleshooting: Unlocking the Profiler
Profilers contain the most valuable performance data, but let’s be honest: they are often difficult to interpret. OpsPilot changes the game with its integrated AI troubleshooting.
With just one click, your profiling data is sent to the AI engine. It instantaneously extracts value (even if you are not a profiling guru) by performing the heavy lifting for you:
- Locates and explains performance bottlenecks in your code.
- Highlights inefficient patterns and identifies critical locking issues.
- Offers actionable optimization advice.
OpsPilot makes your complex profiling data useful instantly, turning raw threads into clear insights.
Database Headaches? Not Anymore!
Database performance issues are notoriously complex. OpsPilot provides instant clarity by automatically analyzing your JDBC statements. With a single action right on the slow statement, you can:
- Detect inefficient queries that are tanking performance.
- Spot blocking behaviors and indexing issues.
- Receive intelligent optimization ideas tailored to your specific SQL.
You can finally get to the bottom of slow database calls without needing to consult a specialized DBA every single time.
AI Inside Every Workflow
OpsPilot’s reach extends across your entire diagnostic workflow, acting as a second set of eyes on every problem:
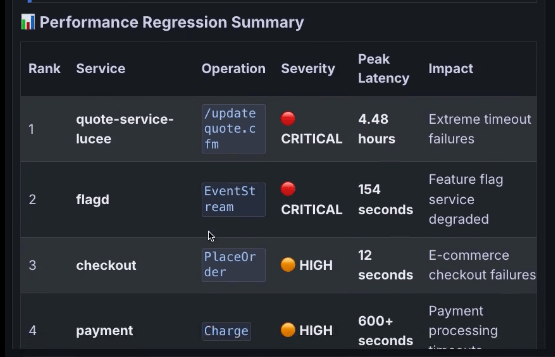
- In Distributed Tracing: Analyze profiles, review SQL calls, and investigate latency issues directly from any trace. OpsPilot summarizes the complexity and highlights the specific operations responsible for the slowdown.
- In Crash Protection: Interpreting complex thread dumps is now obsolete. OpsPilot analyzes the event, explains why the trigger fired, and advises on what needs to be done next. That simple outcome (“No action required”) can save your team hours of unnecessary panic.
- In Events and Logs: OpsPilot acts as your first-pass investigator, analyzing event snapshots and log anomalies to deliver quick summaries and noise reduction.
Your Troubleshooting Timeline is Saved
OpsPilot remembers everything you ask it. Every analysis is stored and can be revisited, creating a permanent, searchable troubleshooting timeline.
This history acts as your team’s institutional knowledge logbook. It allows you to refer back to past diagnoses and build confidence over time. This powerful AI is deployed for developers, SREs, and Ops teams alike. There is no training and no prompt engineering: just a click for immediate, relevant results.
OpsPilot is the integrated AI troubleshooting intelligence layer, built directly into your Errors, Metrics, Traces, Logs, Crash Protection, and Profiles, ensuring it works exactly where you work.
What’s Next?
In the next blog, we will dive into the Centralized Metrics Viewer, where health checks become visual and performance meets unparalleled clarity.