Change is good, but finding your favorite features in a brand-new interface can feel like looking for your keys in the dark. To help you get up to speed with the new OpsPilot UI, we’ve rounded up the most common questions from our users.
Whether you’re looking for real-time data or setting up your next alert, here’s where the magic happens.
1. Digging into Request History
If you’re looking for the Requests section—including history, slow requests, and error logs—it has a new home.
- The Secret Sauce: The UI Tunnel tab.
- How to get there: Navigate to Servers, select your specific server, and open the UI Tunnel.
This tab connects you directly to the FusionReactor on-premise agent UI, giving you the deep-dive history you’re used to.
2. Monitoring Live Activity
Need to see what’s happening right now? For real-time data on currently running requests:
- Open the UI Tunnel tab on your chosen server.
Navigate to Requests > Activity.
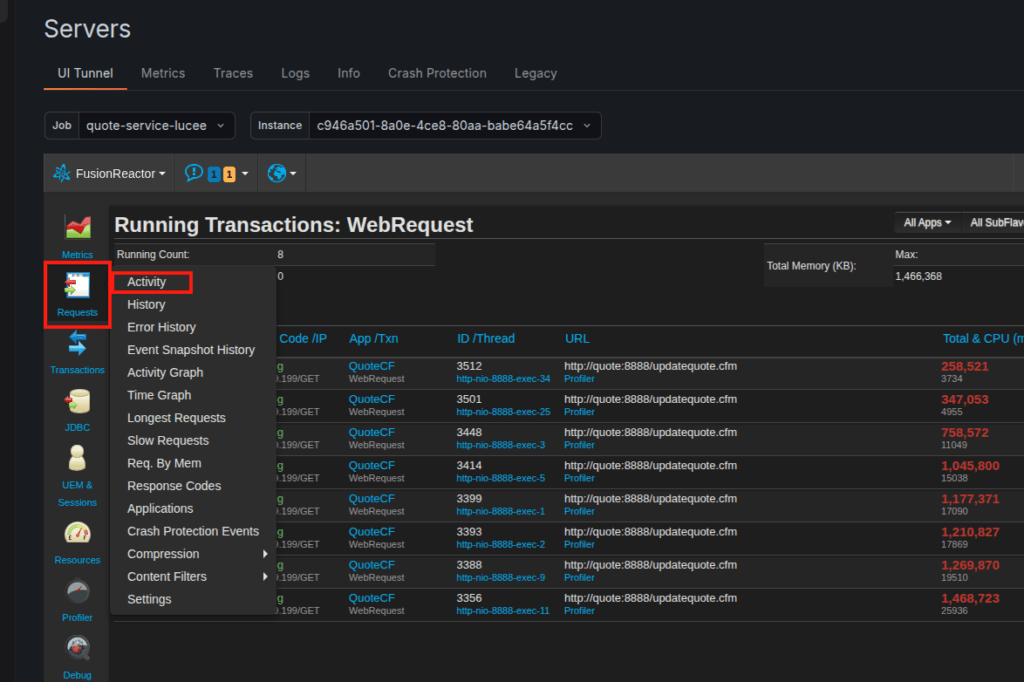
This gives you a live look at every request hitting your server in real time.
3. Finding Your Metrics Graphs
Visualizing your data is key to performance tuning. In the new UI, you have two ways to view your graphs depending on what you need:
For Historical Trends: Select a server and open the Metrics tab. Use the time-frame selector to look back at specific periods.
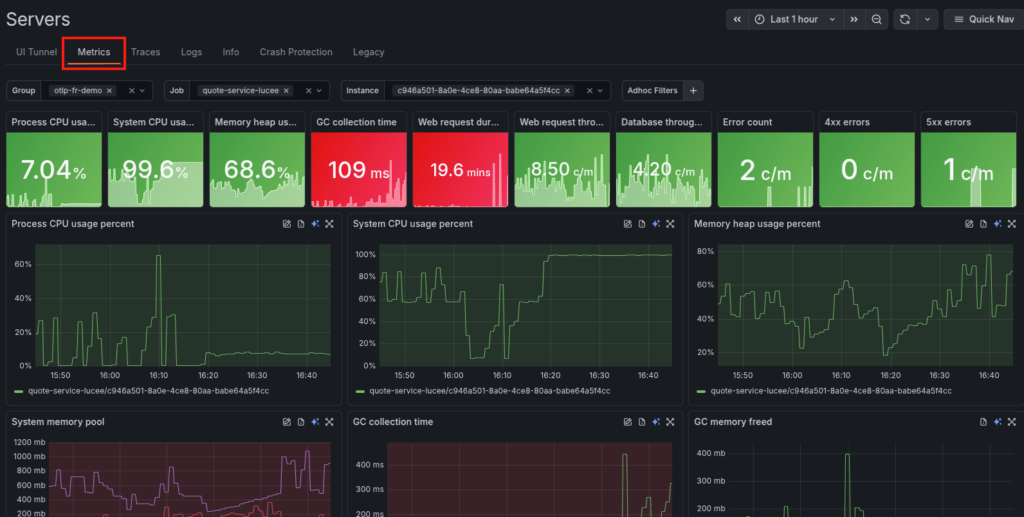
- For Live Agent Metrics: Use the UI Tunnel tab and navigate to Metrics > Web Metrics to see live data directly from FusionReactor.
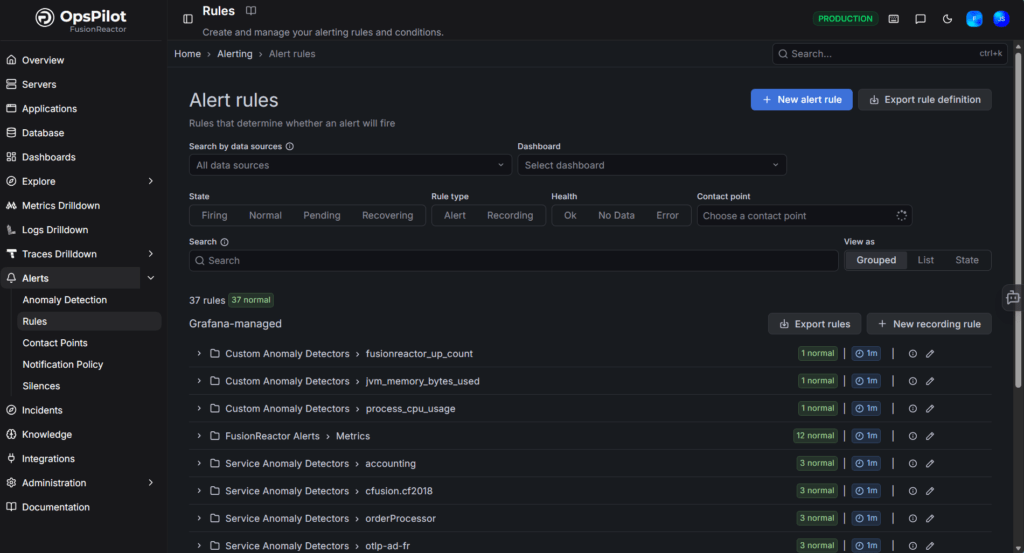
4. Setting Up the New Alerting System
We’ve upgraded our alerting system to be more robust, now powered by Grafana Alertmanager. It’s more flexible, but the setup is a bit different:
- Folders & Groups: Alert rules must now be placed in a specific folder and assigned to an evaluation group.
- Next Steps: We recommend checking out our Alerting Overview for a full walkthrough on contact points and notification policies.
Troubleshooting: “The UI Tunnel isn’t working!”
If you’re having trouble connecting to your FusionReactor instance via the UI Tunnel, don’t panic. The culprit is almost always a network restriction.
The Fix: Ensure Port 443 is open on the server running FusionReactor. The tunnel relies on outbound HTTPS (Port 443) to establish the link. If you’re still blocked, check our Required Endpoints guide to ensure all hostnames are accessible.
Still stuck? > We’re here to help! Click the chat bubble in the corner of your dashboard to speak with our support team.


