New in FusionReactor 7.0.0, we added the ability to monitor your applications usage of Apache Kafka.
Firstly, what is Apache Kafka. Apache Kafka is a publish-subscribe service that allows for multiple system to publish to a given topic and for multiple system to create from a topic. It is commonly used to build real time data pipelines because it is reliable, fast and scalable. To find out more about Apache Kafka visit there website: https://kafka.apache.org/
There are two major aspects of using Kafka the consumers and producers. In this post we are going to talk about how FusionReactor can monitor consumer applications.
Consumer Transactions
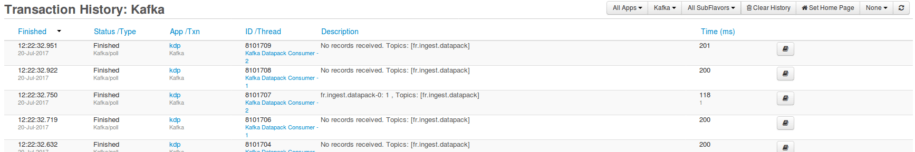
When you start your application with FusionReactor (see Install Guide) we will automatically detect and start tracking calls to the Kafka brokers. These calls are then tracked into transactions and displayed in the Transaction History page.
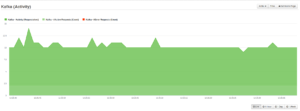
These transaction track the topic that is being polled and the partition that was polled, as well as the number of records returned and the consumer group used. From these transactions we also graph the activity and execution time into the normal transaction graphs in FusionReactor.
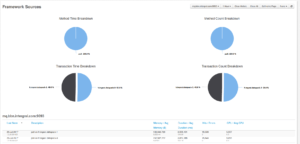
In addition to the standard graphs in FusionReactor if you are using an Enterprise or Ultimate license you will also have access to the ‘Framework Source’ page this page will aggregate the Kafka metrics into a selection of graphs to show how the Kafka usage breaks down by, Broker, Topic and Partition.
Consumer Metrics
When you have a Java application connected to Kafka, there are various metrics available from the driver library. FusionReactor is able to track these metrics and display them over time in a collection of graphs. FusionReactor provides two pages of these graphs Kafka Metrics and Kafka Node Metrics, each page is then displayed based on the selected consumer.
Kafka Metrics
The Kafka Metrics page is intended to give a general overview of the state of the applications use of Kafka, so on this page you will see metrics including:
- Records consumed
- Incoming/Outgoing Bytes
- Commit Rate
- Heartbeat Rate
- And many more..
Kafka Node Metrics
The Kafka Node Metrics include metrics for each consumer that is running in the JVM, split down to each node that is providing the data. These metrics include:
- Incoming/Outgoing Bytes
- Latency
- Request Size
- And many more..
For more information about what these metrics are please visit the Apache Kafka documentation


