Database performance issues are among the most challenging problems in modern application environments. A slow query can cascade through your entire system, affecting user experience and business operations. Yet many organizations struggle with incomplete visibility into their database performance, relying on either application-level monitoring or database-specific tools – but rarely both.
Recent industry research reveals a critical gap: traditional observability platforms excel at monitoring database transactions from the application perspective, but they often lack the deep instance-level diagnostics needed for comprehensive database performance management. The solution? A unified approach that combines both application context and database instance monitoring in a single platform.
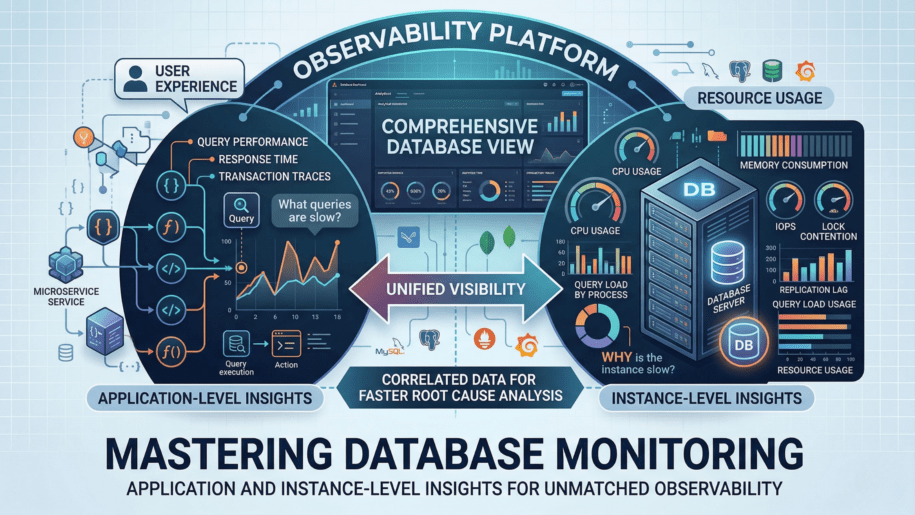
The Two Pillars of Effective Database Monitoring
Application-Level Transaction Monitoring
This is where most observability platforms shine. You get visibility into:
- Query execution times within the context of user requests
- Transaction-level performance showing how database calls impact overall response times
- End-to-end tracing that connects database performance to user experience
- Real-time problem detection when database issues affect application performance
Instance-Level Database Diagnostics
This deeper layer provides the “why” behind performance issues:
- Connection pool management and resource utilization
- Lock contention analysis and blocking query identification
- Buffer pool efficiency and memory optimization insights
- Thread activity patterns and concurrency bottlenecks
- Query pattern analysis for optimization opportunities
The Problem with Fragmented Monitoring
Many organizations end up with a fragmented approach:
- Observability platforms that show transaction-level database performance but can’t explain root causes
- Database-specific monitoring tools that provide deep diagnostics but lack application context
- Disconnected alerting systems that create noise instead of actionable insights
- Multiple dashboards that make correlation and troubleshooting time-consuming
This fragmentation leads to longer mean time to resolution (MTTR), missed optimization opportunities, and reactive rather than proactive database management.
OpsPilot: Unified Database Observability
OpsPilot addresses these challenges by providing both application-level and instance-level database monitoring in a single, integrated platform. Here’s how we deliver comprehensive database observability:
Complete Transaction Visibility
Our JDBC monitoring provides detailed insights into every database interaction:
- Automatic query plan analysis using database EXPLAIN features
- Slow query identification with immediate context about which user requests are affected
- Sub-transaction breakdown showing exactly where time is spent within database calls
- Security-conscious query obfuscation to protect sensitive data
Deep Instance-Level Monitoring
Through our Prometheus-based database integrations, you get comprehensive instance diagnostics:
Connection Management:
- Real-time connection pool utilization
- Peak connection tracking and capacity planning
- Connection efficiency metrics
Performance Analysis:
- Thread activity patterns and concurrency analysis
- Lock contention indicators and blocking query detection
- Temporary object creation patterns that indicate inefficient queries
- Query type distribution for optimization insights
Resource Optimization:
- Buffer pool utilization and memory efficiency
- Thread cache performance
- I/O patterns and disk utilization
Unified Dashboard Experience
Instead of switching between multiple tools, you get:
- Single pane of glass for all database monitoring needs
- Correlated metrics that show both application impact and database root causes
- Consistent alerting that reduces noise and focuses on actionable issues
- Historical analysis for capacity planning and trend identification
Real-World Benefits: What This Means for Your Team
Faster Problem Resolution
When a database performance issue occurs, you don’t need to:
- Switch between multiple monitoring tools
- Correlate timestamps across different systems
- Guess which database metrics relate to application problems
Instead, you see the complete picture immediately: which users are affected, what queries are slow, and why the database is struggling.
Proactive Performance Management
With both application and instance-level data, you can:
- Identify optimization opportunities before they become problems
- Plan capacity upgrades based on actual usage patterns
- Tune database configurations using comprehensive performance data
- Prevent issues rather than just react to them
Reduced Tool Complexity
A unified platform means:
- Lower total cost of ownership compared to multiple specialized tools
- Simplified training for your team
- Consistent user experience across all monitoring activities
- Easier integration with your existing workflows
Database-Specific Monitoring Made Simple
OpsPilot supports comprehensive monitoring for major database platforms, such as MySQL Monitoring
Our MySQL integration provides detailed insights into:
- Connection pool efficiency and thread activity
- InnoDB buffer pool utilization
- Table lock patterns and query optimization opportunities
- Temporary table creation and SELECT operation analysis
Multi-Database Support
Through our extensible Prometheus-based architecture, we support monitoring for:
- PostgreSQL with connection and query performance metrics
- SQL Server with detailed performance counter integration
- Oracle with comprehensive instance-level diagnostics
- MongoDB with replica set and sharding insights
Getting Started with Comprehensive Database Monitoring
- Application-Level Setup
Deploy FusionReactor Java agents to your Java applications for immediate transaction-level database visibility.
- Instance-Level Integration
Configure our database integrations to collect instance-level metrics from your database servers.
- Dashboard Configuration
Use our pre-built database dashboards or customize them for your specific monitoring needs.
- Alert Optimization
Set up intelligent alerts that combine application and database metrics for actionable notifications.
The Future of Database Monitoring
The industry is moving toward unified observability platforms that provide both application context and infrastructure depth. Organizations that adopt this approach early gain significant advantages:
- Faster incident response through comprehensive visibility
- Better performance optimization using complete data sets
- Reduced operational complexity with fewer tools to manage
- Improved team productivity through streamlined workflows
Conclusion: Why Settle for Partial Visibility?
Database performance affects every aspect of your application’s user experience. Partial monitoring – whether application-only or database-only – leaves critical blind spots that can impact your business.
OpsPilot eliminates these blind spots by providing comprehensive database observability in a single platform. You get the application context you need to understand business impact, combined with the database diagnostics required for effective troubleshooting and optimization.
Ready to transform your database monitoring strategy? Discover how OpsPilot can provide the complete visibility your team needs to keep your databases and your applications performing at their best.


