Get a comprehensive view of your server health with FusionReactor Cloud’s latest feature.
Modern infrastructure monitoring demands both depth and clarity. FusionReactor Cloud’s new Server Scenes feature joins the robust Explore section, complementing the existing Metrics, Logs, and Traces views to provide a complete monitoring solution. This latest addition delivers an intuitive, high-level view of your infrastructure and services. Let’s explore how this powerful new feature can enhance your monitoring capabilities.
The Complete Explore Suite
FusionReactor Cloud’s Explore section now offers a comprehensive monitoring toolkit:
- Metrics: Deep dive into specific performance metrics and trends
- Logs: Analyze detailed system and application logs
- Traces: Track request flows and identify bottlenecks
- Server Scenes: Get a high-level view of your infrastructure health
Accessing Server Scenes
Getting started with Server Scenes is straightforward:
- Navigate to the Explore tab in the top navigation bar
- Click the Servers button to access the overview
Understanding the Overview
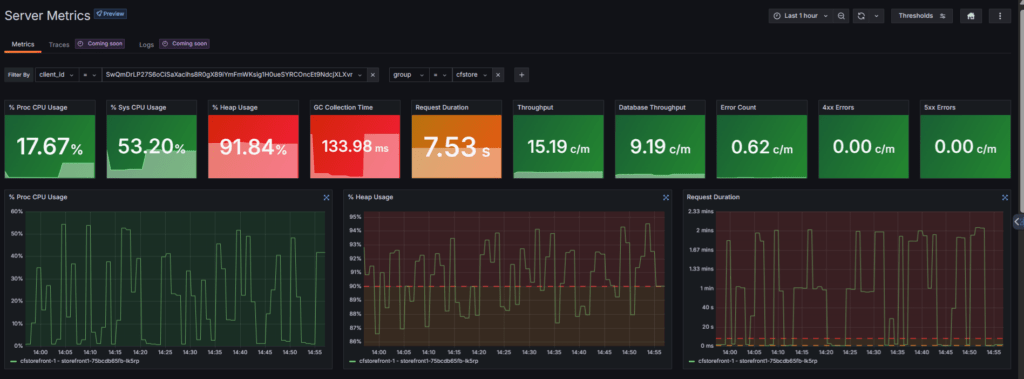
The Server Scenes dashboard presents a comprehensive health overview of all services running on your servers. This view offers several powerful features:
- Flexible Grouping: Organize your servers in multiple ways to match your monitoring needs
- Advanced Filtering: Narrow down the view to focus on specific server groups or metrics
- Customizable Metrics: Choose which metrics to display, ensuring you see the most relevant data for your use case

Enhanced Visualization Features
Each metric comes with powerful visualization options:
- Expandable graphs for detailed analysis
- Customizable timeframes
- Auto-refresh functionality to keep data current
- Easy-to-read graphical representations
Customizable Threshold Management
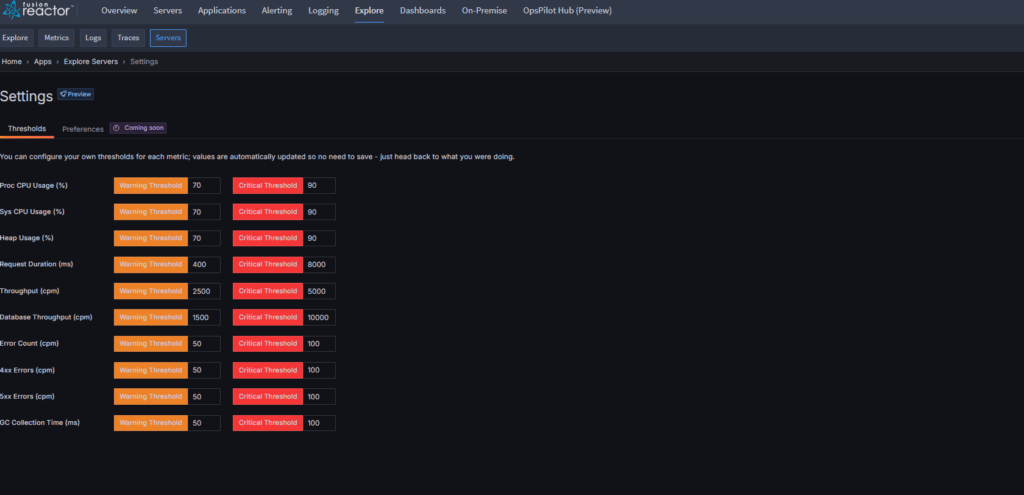
One of Server Scenes’ most powerful features is its flexible threshold management system:
- Color-coded thresholds for quick status identification
- Individually customizable thresholds at both overview and server-specific levels
- Accessible via the Thresholds button in the top right
- Configurable alerts to match your specific requirements
Why Server Scenes Matters
Server Scenes represents a significant step forward in infrastructure monitoring, offering:
- Immediate visibility into server health
- Customizable views for different team needs
- Quick access to detailed metrics
- Flexible threshold management
- Seamless integration with existing Metrics, Logs, and Traces views
Whether managing a small cluster or a large-scale infrastructure, Server Scenes complements FusionReactor Cloud’s existing monitoring capabilities, providing the insights you need to maintain optimal performance and quickly identify potential issues.
Watch the video above to see Server Scenes in action, and try it yourself in FusionReactor Cloud today.


