In this blog, we are going to cover the dashboards available in FusionReactor.
What Are FusionReactor Dashboards?
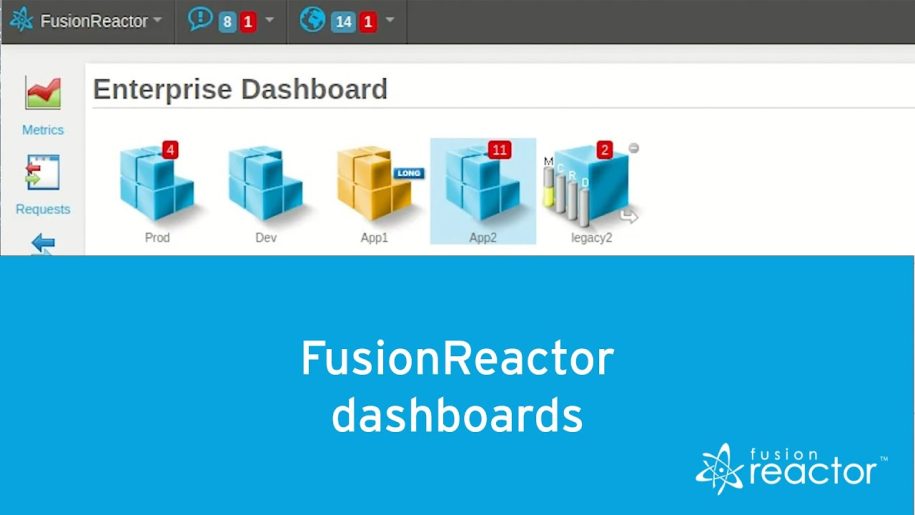
Dashboards allow you to see the health of your environment with a quick glance. FusionReactor Dashboards allow for instances to be grouped or viewed as standalone instances. They are represented as cubes that can change color as the state changes from OK to Warning to Error.
Instances
Groups or instances in blue are marked as OK, Yellow as Warning, and Red as an error. The state of an instance can change based on configurable values. For example, high CPU, high Memory, long-running requests, or long-running database queries.
Looking at the dashboard, there are 4 groups, 2 for the environment and 2 for the application. Instances can be placed in as many groups as you require and as a result, the dashboard will scale to thousands of instances.
Within a group, you can see summary metrics. On each instance, you have the memory, CPU, request time, and Database time highlighted in the bars. When drilling into a specific instance you can see activity metrics in more detail. For example, request activity, notifications, and resource information.
If you see an instance that has an issue, for example, the staging instance that appears to have a long request, we can open the instance to find the cause of the issue by clicking the instance link.
Register Instances
To register instances, you can either manually add instances or groups to your dashboard in the server manager. In addition, you could use automatic registration.
Automatic Registration
By using automatic registration, a tunnel is created between the dashboard and the instance, therefore allowing access to data on the instance without needing to expose ports or firewall holes. This is ideal if you are using dynamic or containerized environments where accessible static ports are not always an option.
The dashboards allow you to see a holistic view of your infrastructure. But most importantly drill into any issues from a single location. For more information see docs.fusion-reactor.com.
Visit support.fusion-reactor.com if you have any questions.


