FusionReactor Cloud (the SaaS solution) has a lot of functionality that the traditional on-premise Java agent (On-Prem) has, but has struggled with the perception that its not as ‘real-time’.
Both Cloud and On-Prem have live mode for many features; both have the same information and update as quickly.
Live Graphs
Graphs in both FusionReactor On-Prem and Cloud support live mode i.e. updating every second.
Below are screenshots showing the main metrics updating live (every 1 second). For On-Prem, you can see the WebMetrics page with a refresh rate of 1 second. For Cloud, you can see the server graphs with the WebServer profile and ‘live mode’ enabled.
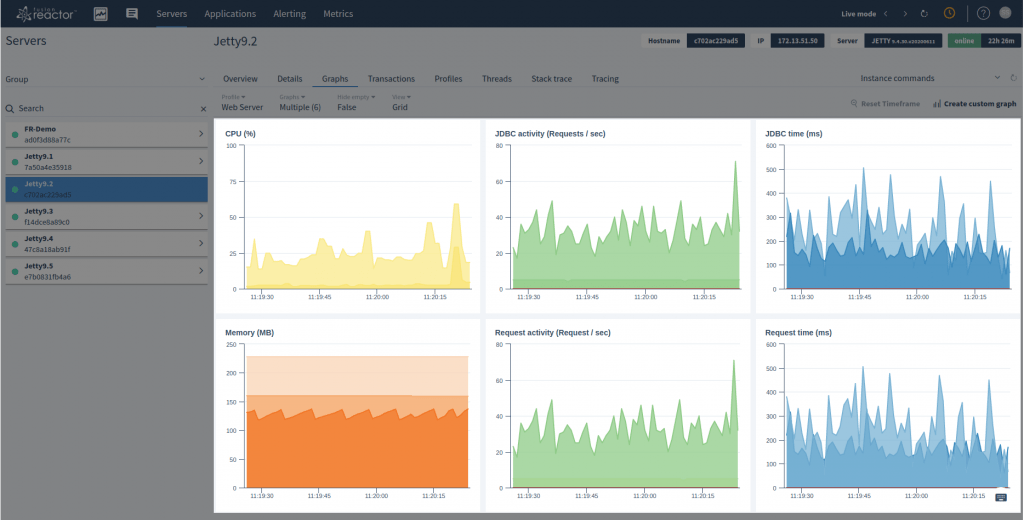
Cloud – Graphs Page
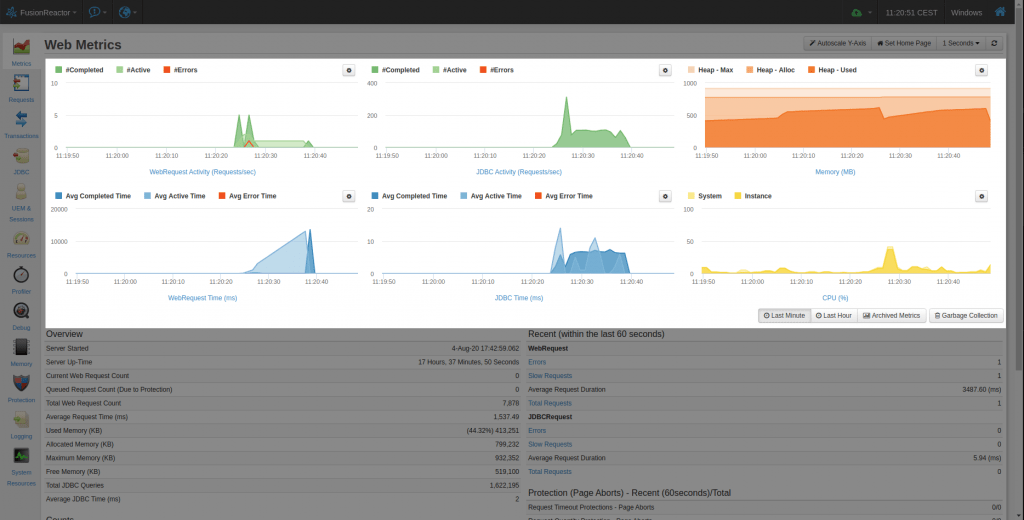
On-Prem – WebMetrics
To enable live mode in Cloud, simply click the ‘Live mode’ which can be found along side the time picker. Enabling live mode with the On-Prem solution, you simply adjust the refresh interval to 1 second.
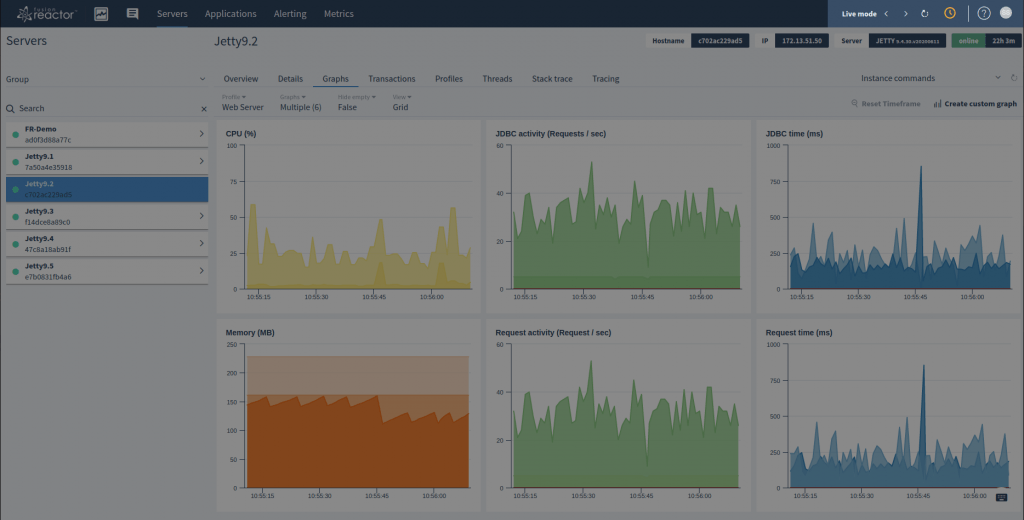
Cloud – Live Mode Toggle
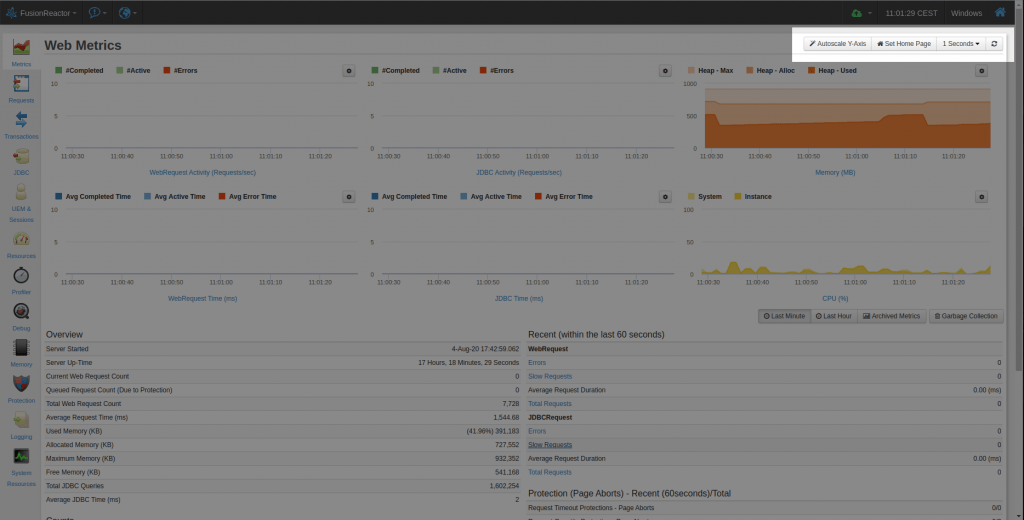
On-Prem – Refresh Interval
Both pages show the same data and both come from FusionReactor’s live metrics. The only difference is in the UI graph rendering – On-Prem updates the graphs all at the same time and Cloud updates each one asynchronously.
Custom Graphs
FusionReactor Cloud supports custom graphs (even custom metrics) which allow you to customize the series that the graphs show. These can be set to run in live mode (update every second) like On-Prem, but On-Prem only supports showing 1 series at a time on its custom metrics page.
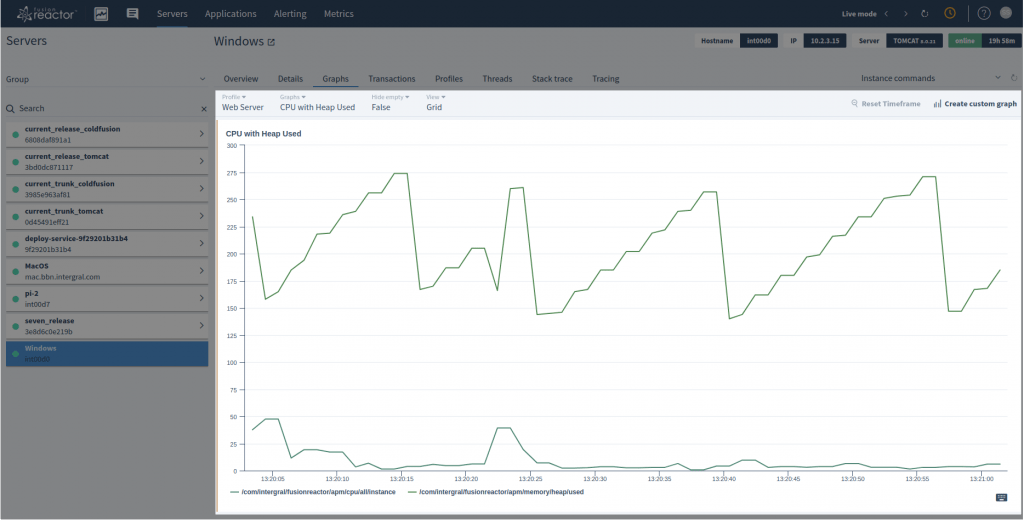
Cloud – Live Mode with a Custom Graph
Running Transactions
FusionReactor On-Prem and Cloud both have the ability to show running requests. FusionReactor On-Prem has a page (Requests -> Activity) that updates every second to show the active requests being tracked by FusionReactor and how long they have been running.
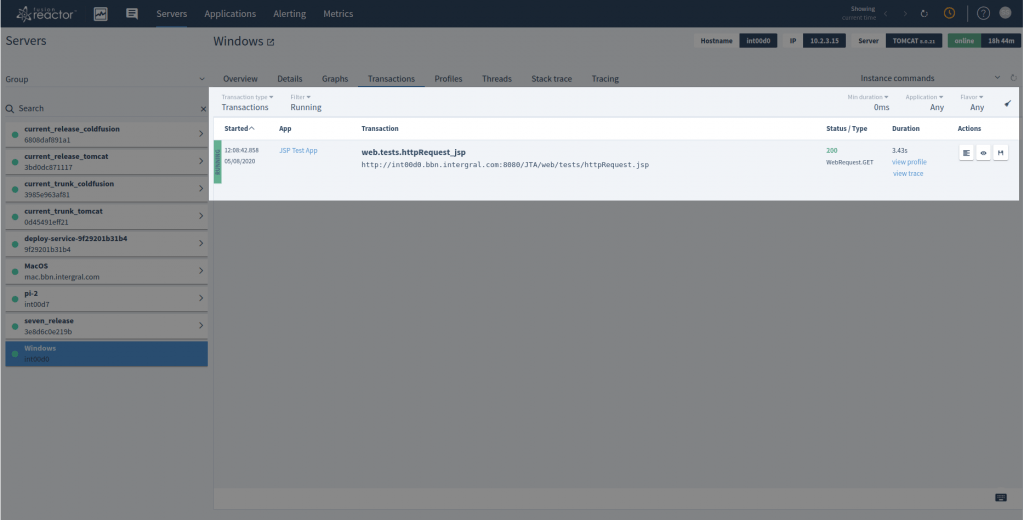
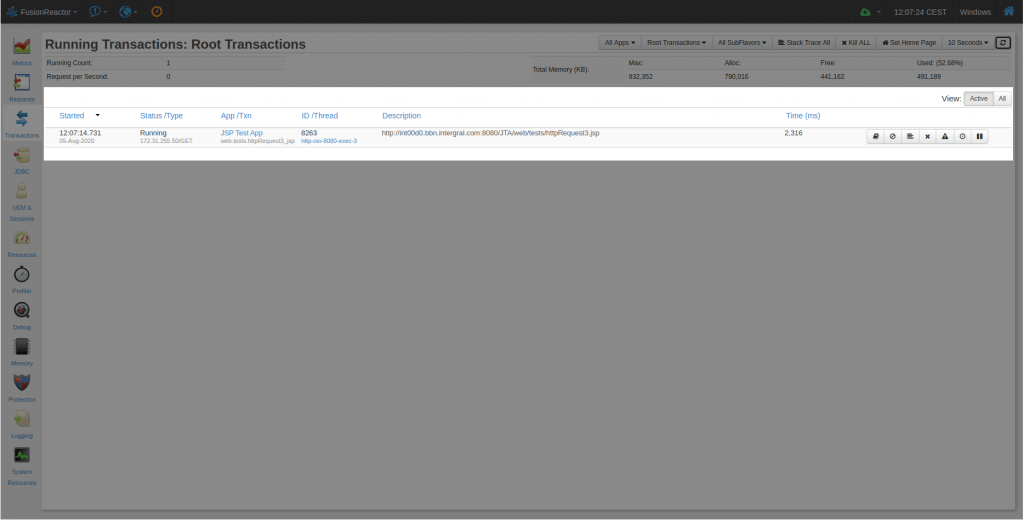
FusionReactor Cloud has the exact same functionality, available from the Transactions page when you select ‘Running’ requests.
Both views will show the profiler link if the slow request has been running for longer than the threshold for the profiler.
Both views can be set to refresh every second.
Stacktrace
Both On-Prem and Cloud versions of FusionReactor have the ability to show the current threads and their status, as well as to show the stacktrace for all the live threads.
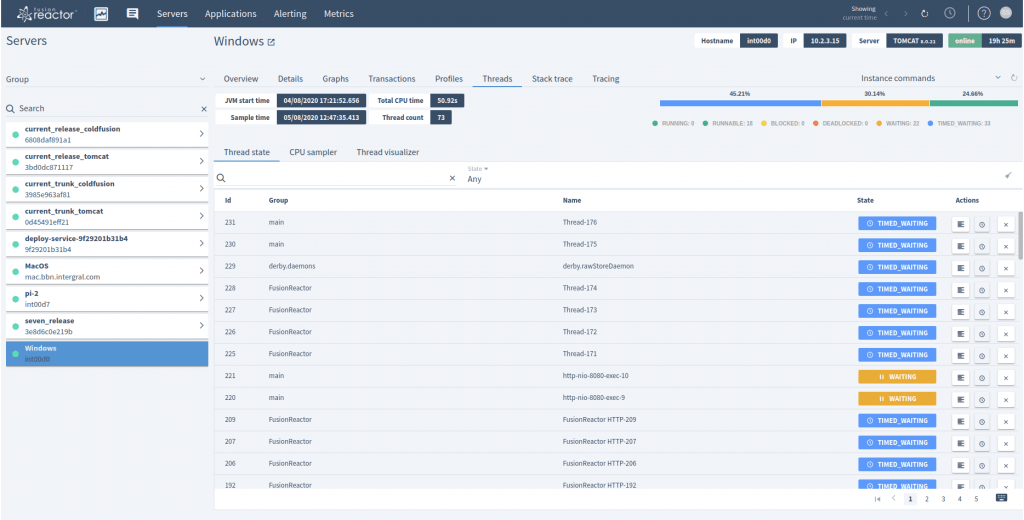
Cloud – Thread List
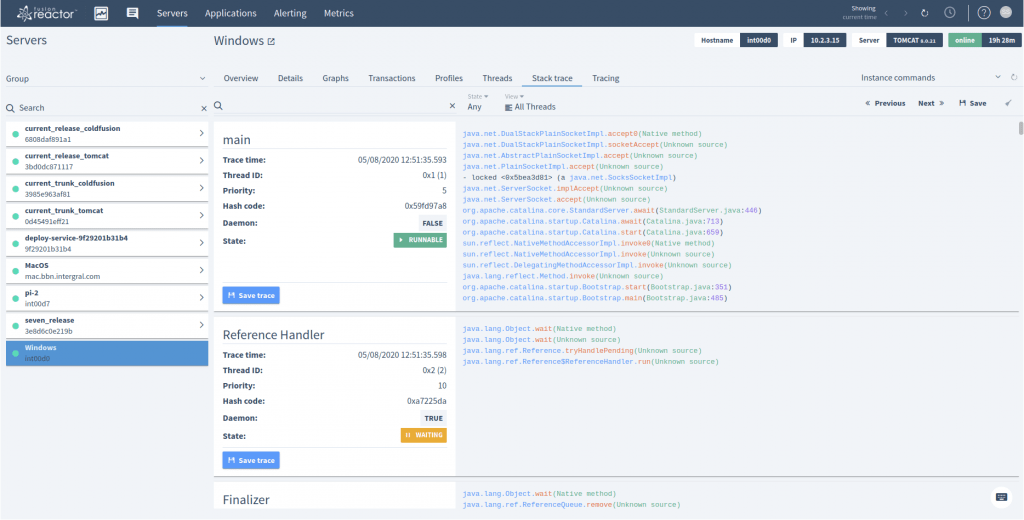
Cloud – StackTrace All
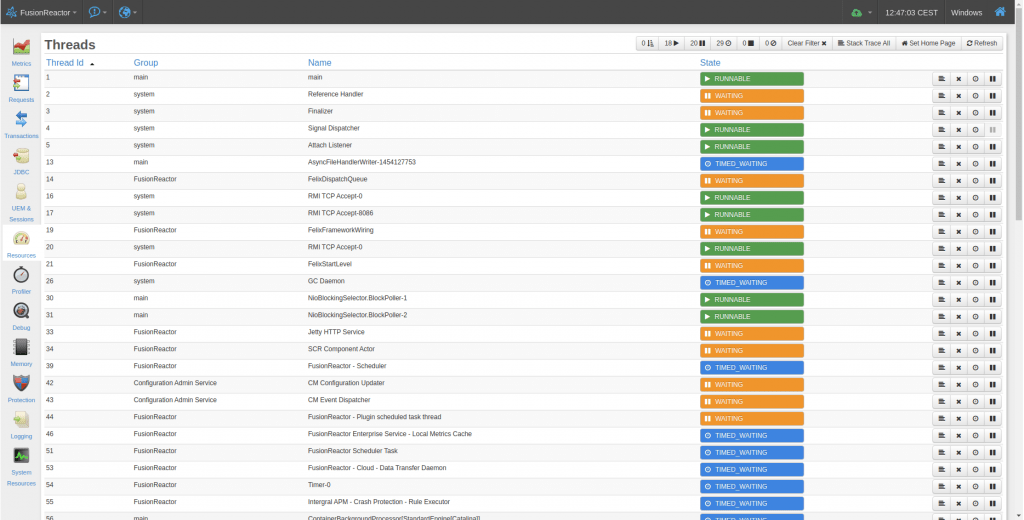
On-Prem – Thread List
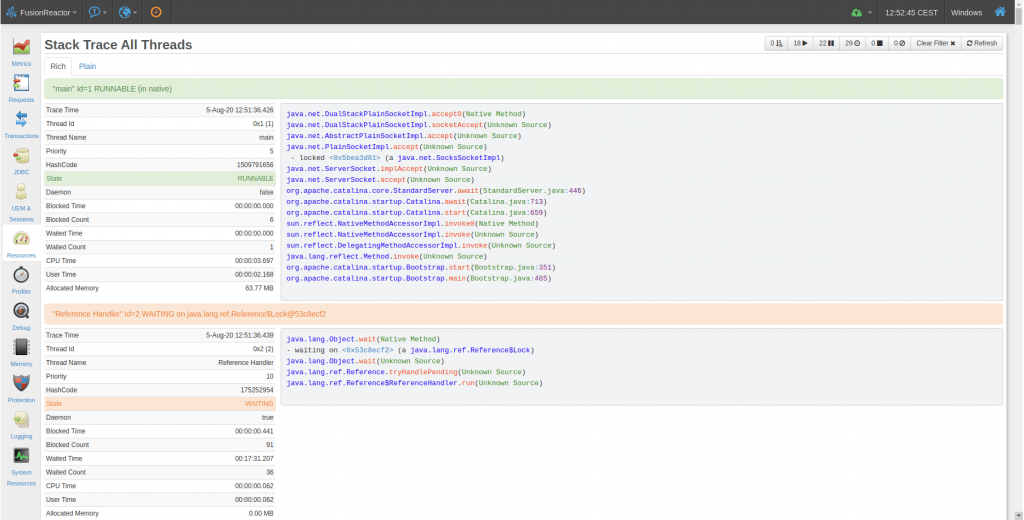
On-Prem – StackTrace All
Thread Visualizer
The thread visualizer is available in both FusionReactor On-Prem and Cloud. Both update every second to show you which threads are running.
The view can be sorted by CPU time, allowing you to track down CPU usage to a specific thread or a set of threads.
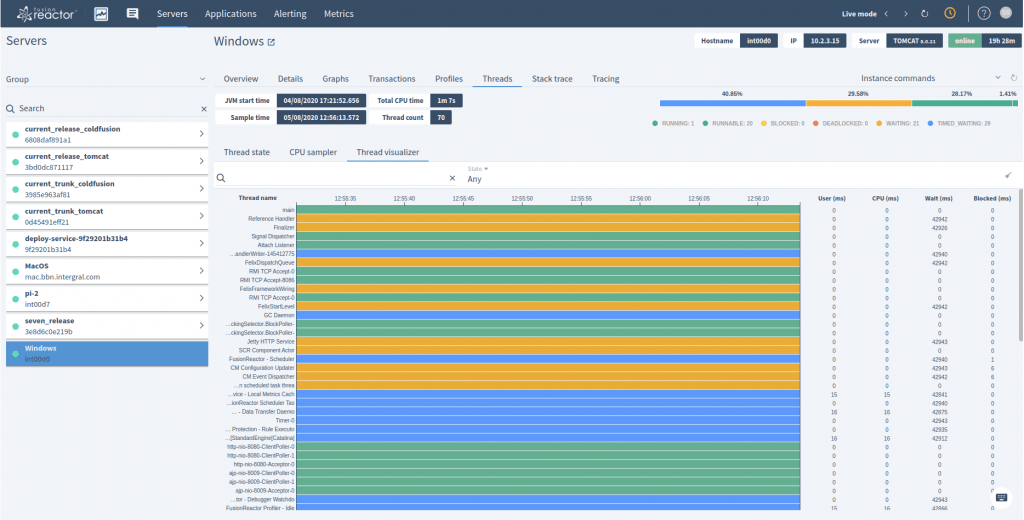
Cloud – Threads -> Thread Visualizer
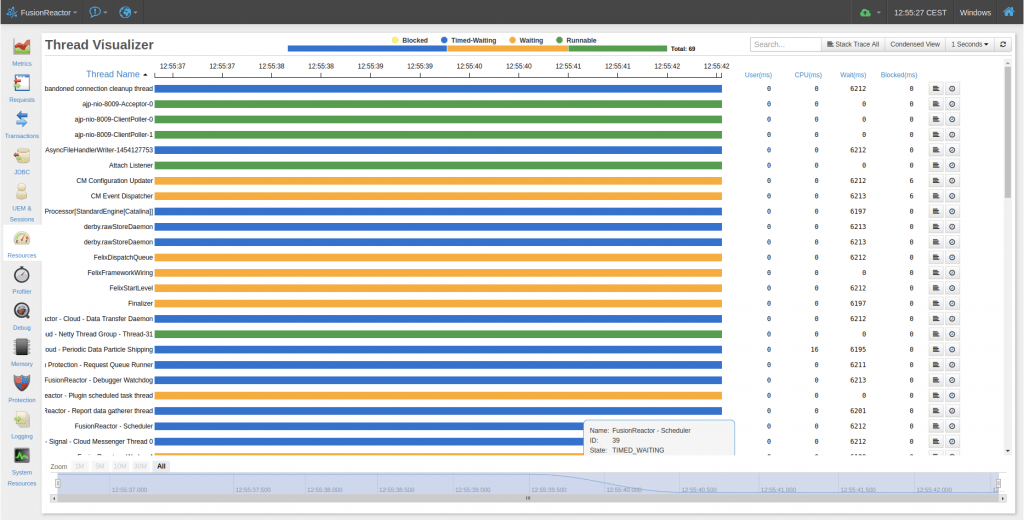
On-Prem – Resources -> Thread Visualizer
CPU Sampler
The CPU sampler in both the Cloud and On-Prem shows which threads are using the most CPU, similar to the Thread Visualizer. Both update every second showing real time updates/deltas per thread.
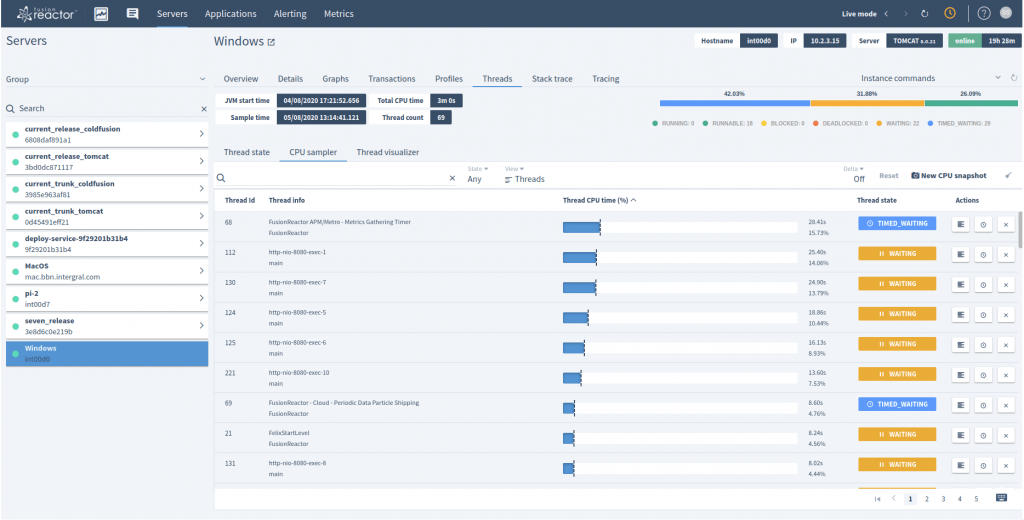
Cloud – CPU Sampler
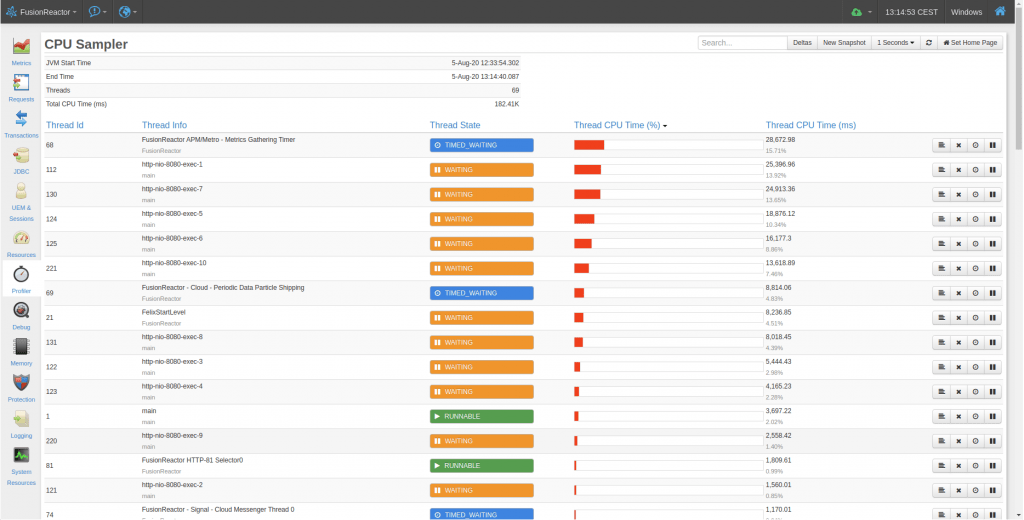
On-Prem – CPU Sampler
Profiler
The profiler view for running transactions shows the profile information each time the refresh button is pressed. Both On-Prem and Cloud show the same accuracy of data when the transaction is running.
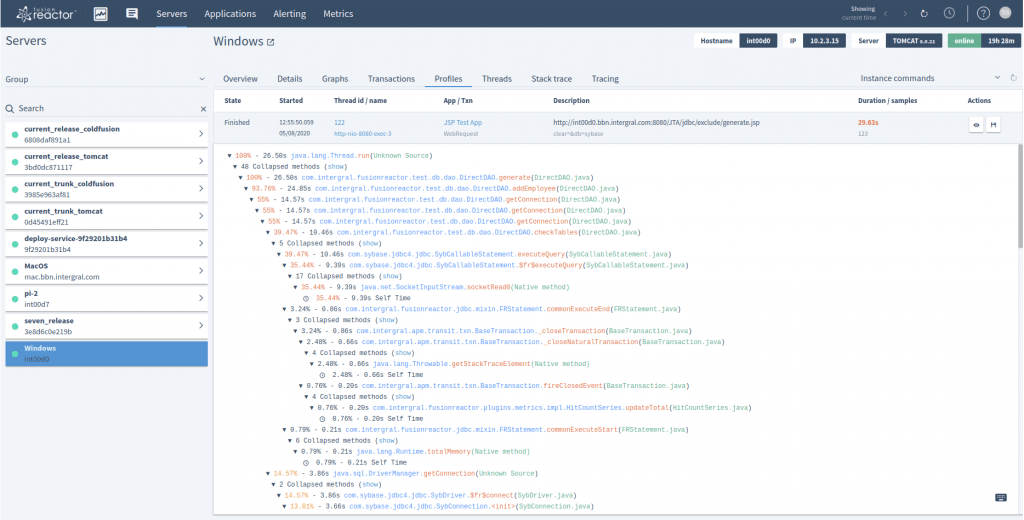
Cloud – Profile Details
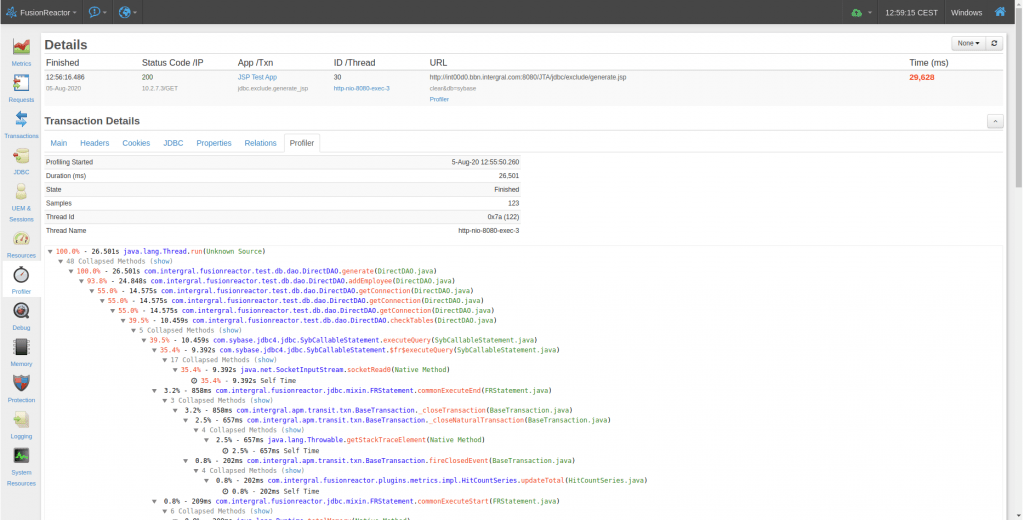
On-Prem – Transaction Details Profile Tab
Log Viewer
The Log Viewer in the Cloud shows the actual realtime logs from the FusionReactor instance and matches the On-Prem Logs page.
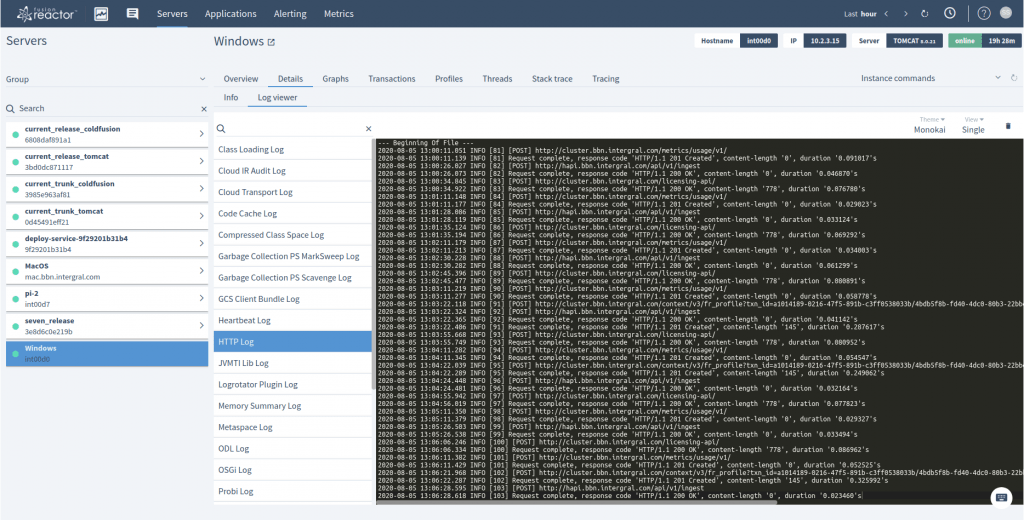
Cloud – Log Viewer
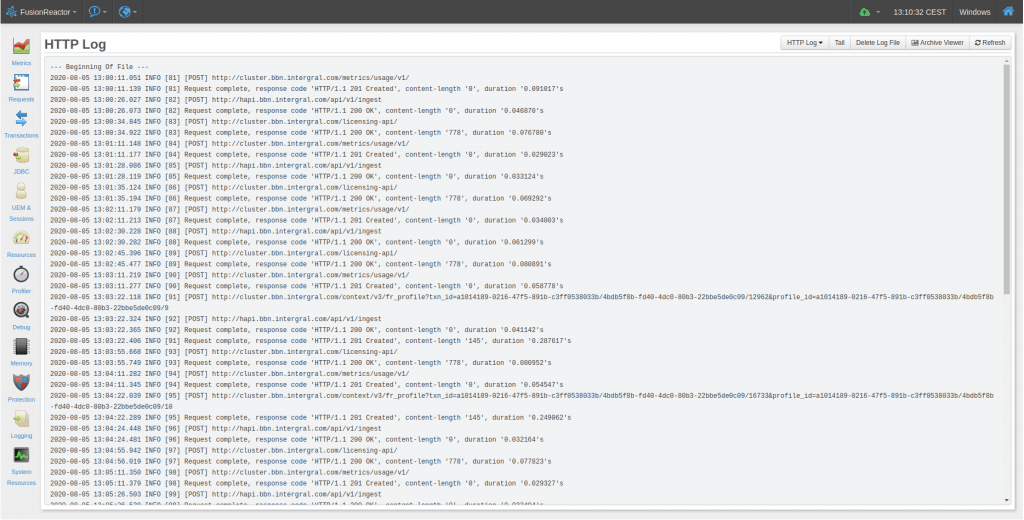
On-Prem – Log Viewer


