Introduction
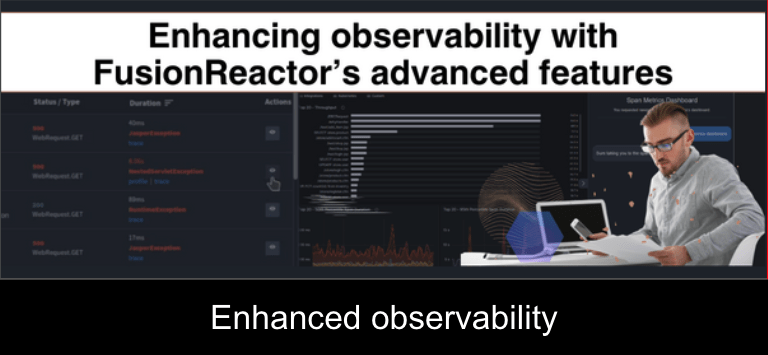
Now that you’re familiar with the basics of FusionReactor, it’s time to dive deeper into the more advanced features of FusionReactor Cloud. This post will cover everything from intelligent event linkage to database monitoring.
Log mastery
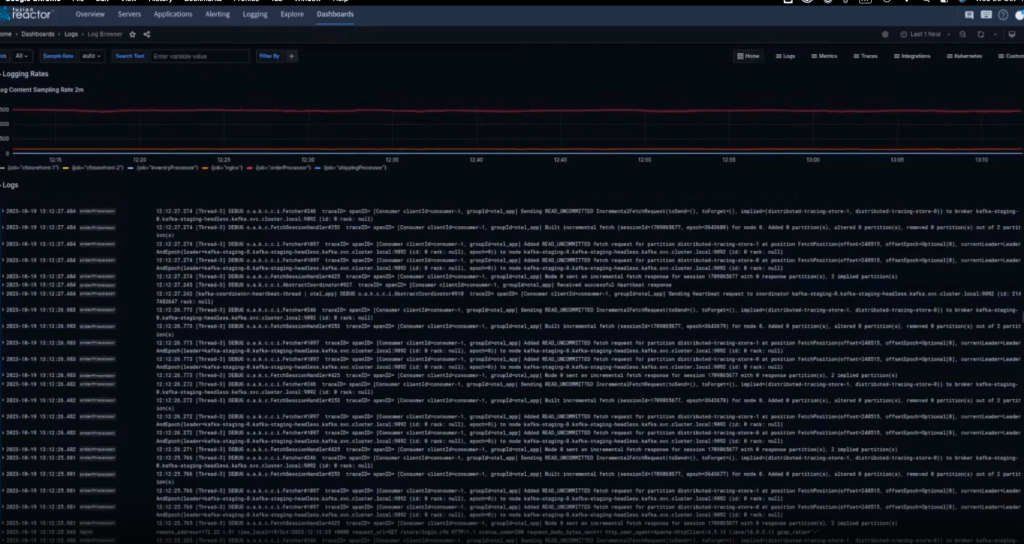
The FusionReactor Cloud isn’t just about metrics; it’s also about mastering your logs. With support from industry leaders like Promtail, Fluent Bit, and LOGBack, you can now sort through a flood of information with precision filtering and intuitive search.
Database monitoring
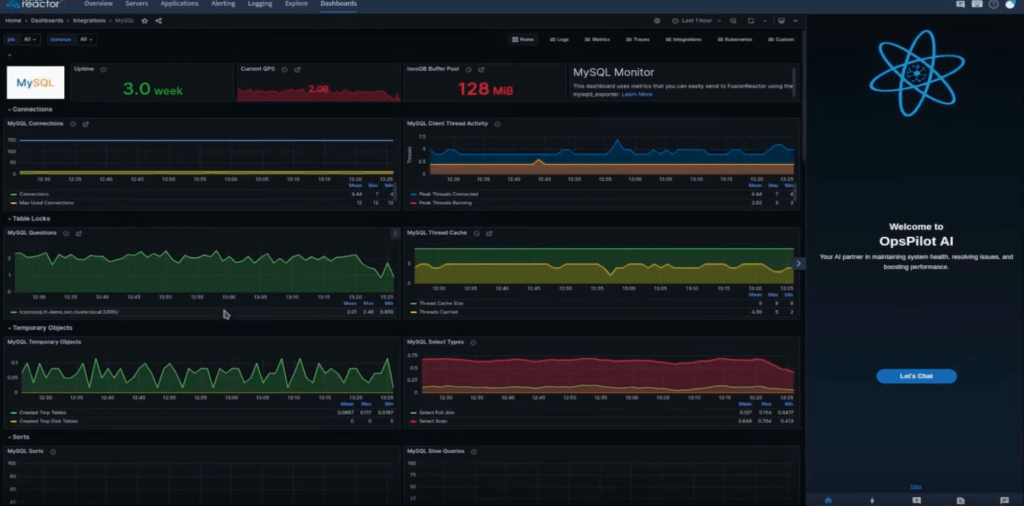
One of the core components of any application is the database. FusionReactor Cloud offers database-specific dashboards like the MySQL Dashboard that go beyond raw data and give you insights into the rhythm and flow of your database operations.
Conversational monitoring with OpsPilot
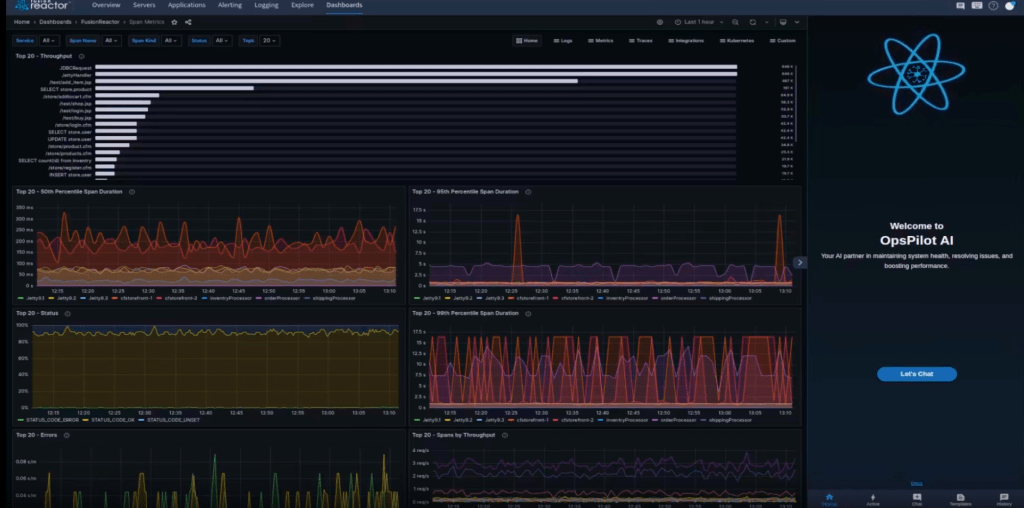
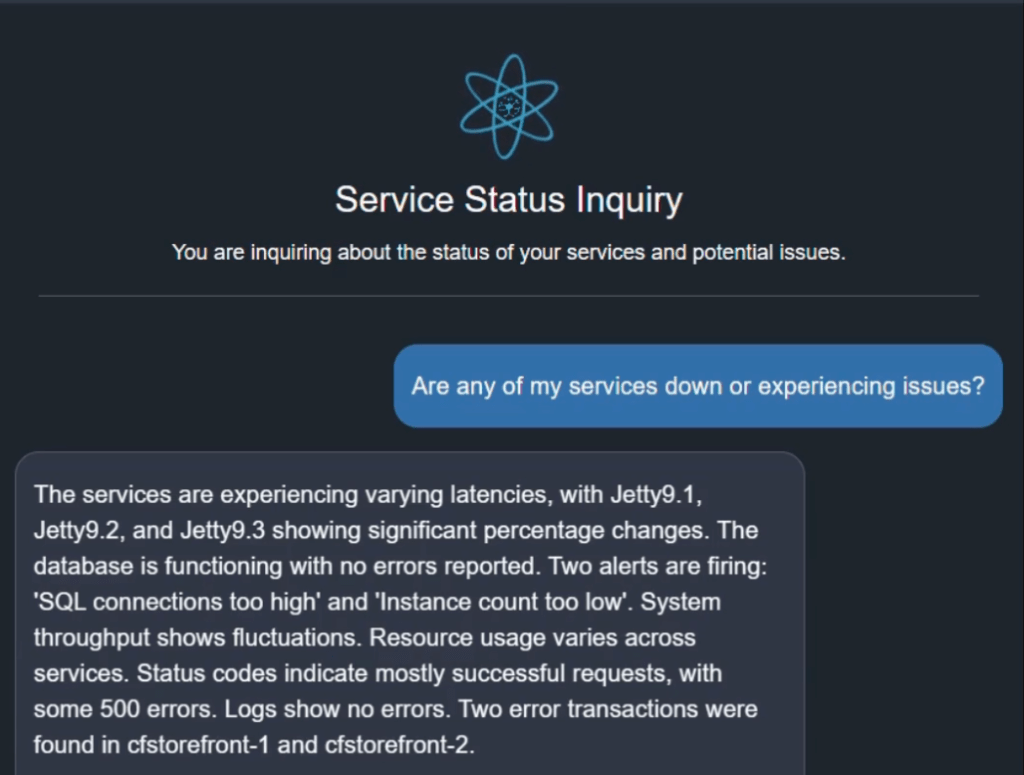
Why merely observe when you can interact? OpsPilot allows you to pose natural language queries about system health. This brings a conversational element to monitoring, making it more engaging and less of a chore.
Wrapping up with OpsPilot
OpsPilot is more than an assistant; it’s your colleague. With its AI-driven, context-aware capabilities, OpsPilot ensures that you’re collecting data and understanding it. Moreover, OpsPilot keeps a history of all your queries and answers, ensuring you never miss a thing.
Conclusion
Advanced features of FusionReactor Cloud, such as intelligent event linkage, advanced log monitoring, and OpsPilot’s conversational capabilities, make it the ultimate tool for application performance monitoring.

