Centralized Metrics: One Dashboard for Complete Server Health in FusionReactor Cloud
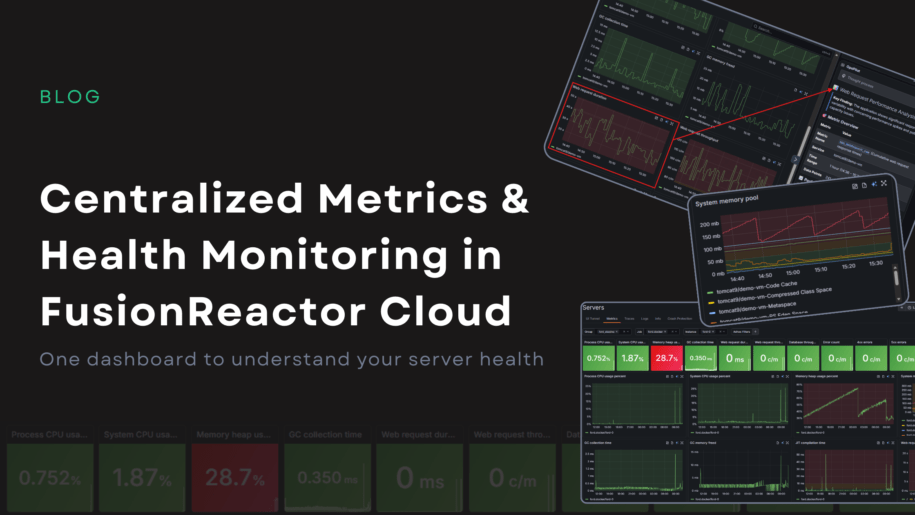
Metrics are only useful if they help you take action. FusionReactor Cloud’s new Centralized Metrics Viewer turns raw monitoring data into clear, meaningful visual indicators, making it easy to understand the health of your servers at a glance. Everything you need to diagnose system behavior is now in one unified and interactive experience.
A metrics dashboard designed for real workflows
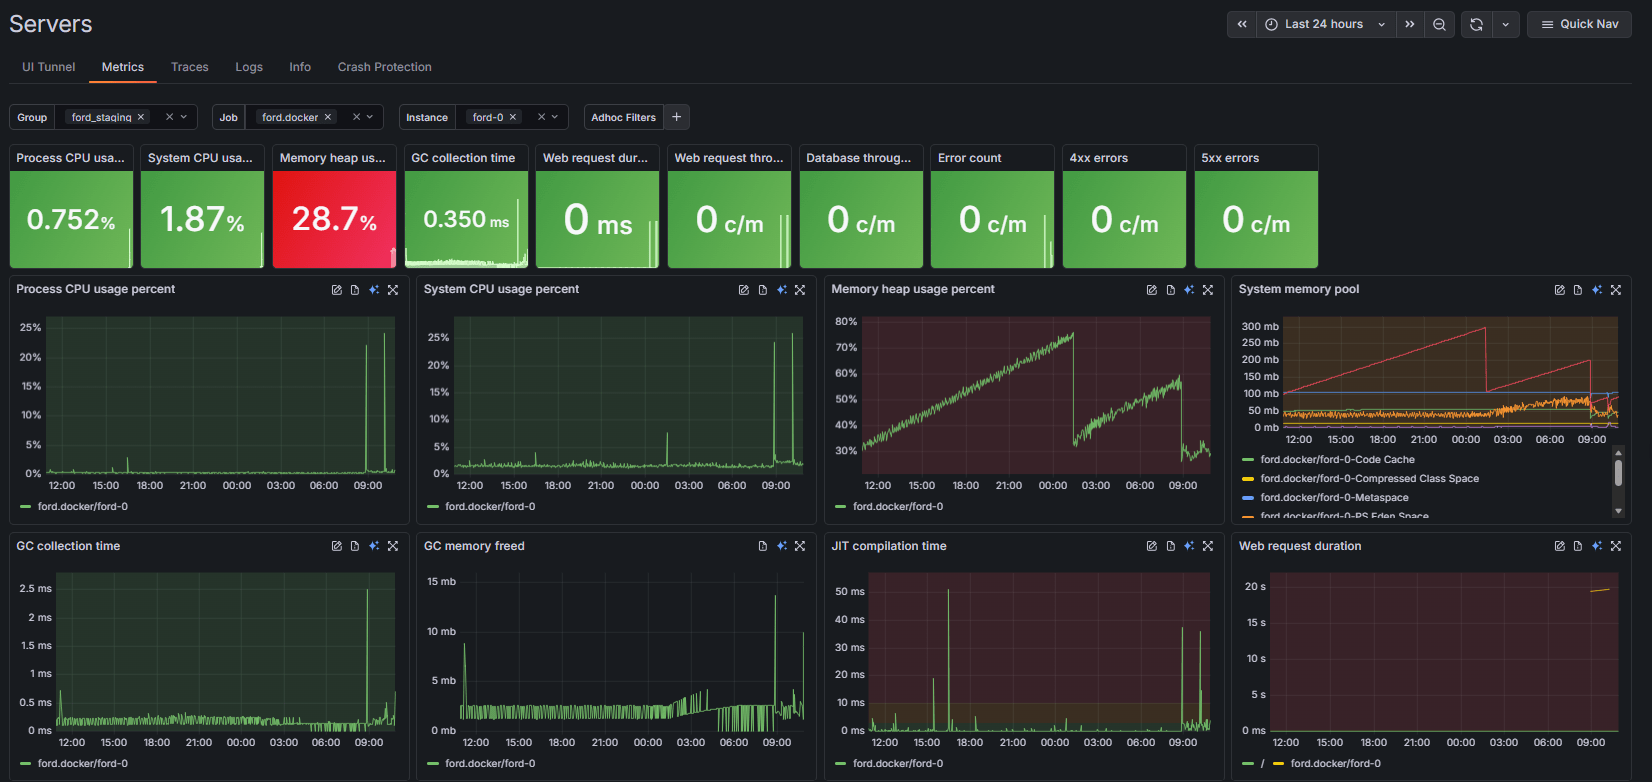
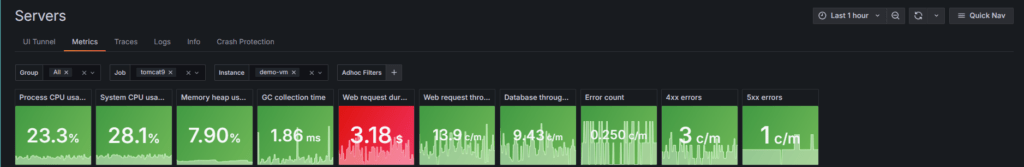
The Metrics page organizes your environment using group filters, jobs, and instances. This structure makes it easy to focus on exactly the set of servers you care about without noise or clutter. Right at the top, key health tiles summarize the most important metrics, including:
- Process and System CPU usage
- Memory heap usage and GC collection time
- Web request duration and throughput
- Database throughput
- Error counts, including specific 4xx and 5xx errors
Each tile shows live trends and large percentage or count values, letting you spot anomalies instantly.
Green means healthy
FusionReactor Cloud uses a clear and intuitive health-state color system. Healthy systems render all tiles in green, while anomalies stand out sharply in red. For example, if your CPU and Memory are performing well, those tiles remain green, but a sudden spike in Web request duration will trigger a bright red warning tile. This makes problems impossible to miss, even when you are monitoring dozens of servers at once.
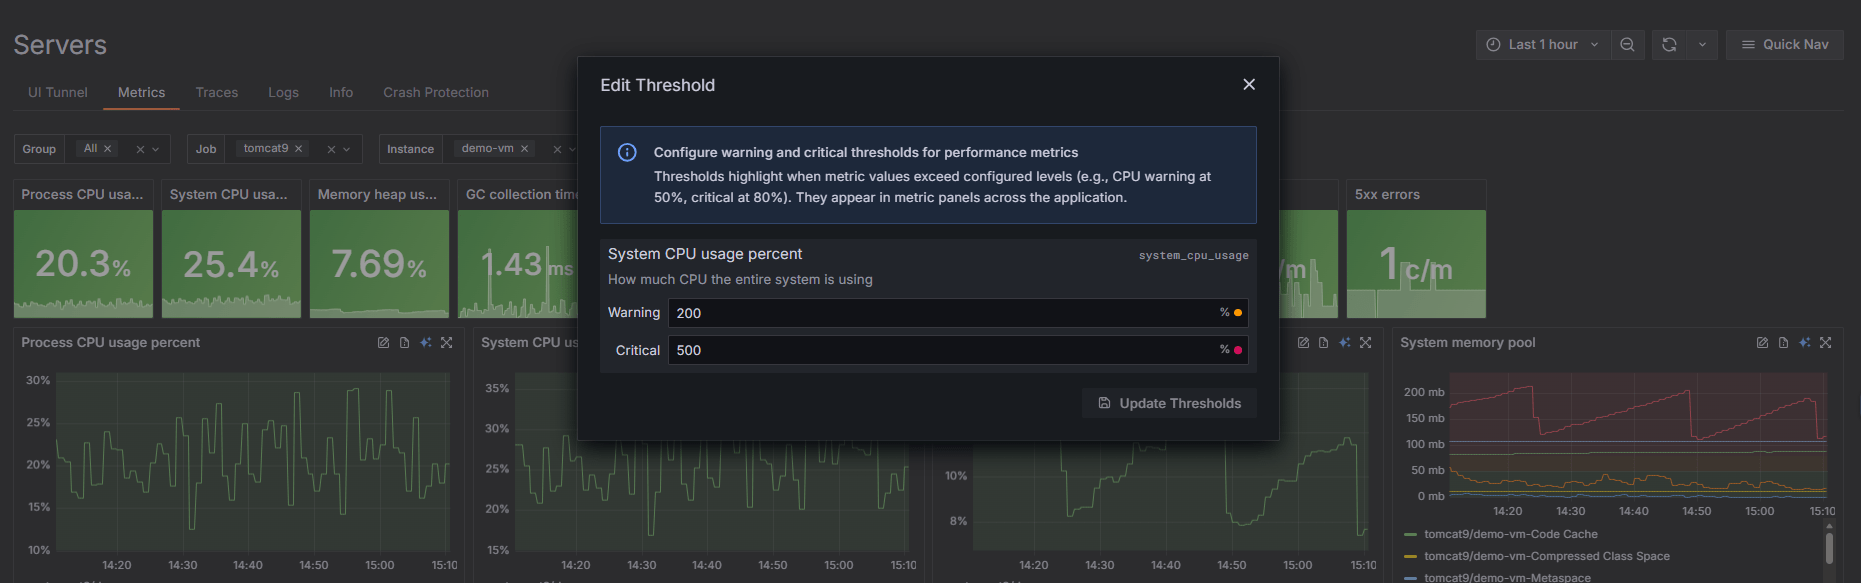
Fully configurable thresholds
Every environment is different, so every threshold is customizable. You can adjust warning and critical thresholds for CPU, Heap usage, GC time, and error rates to ensure your alerts align with your specific performance standards.
These changes are remarkably easy to implement: simply click the Edit Threshold button in the top-right corner of the relevant metric graphs. You can modify these settings directly in the metric tiles without restarting any services. The result is a monitoring system tailored to your specific reality, providing you with alerts that are actually meaningful to your operations.
Interactive graphs that let you explore freely
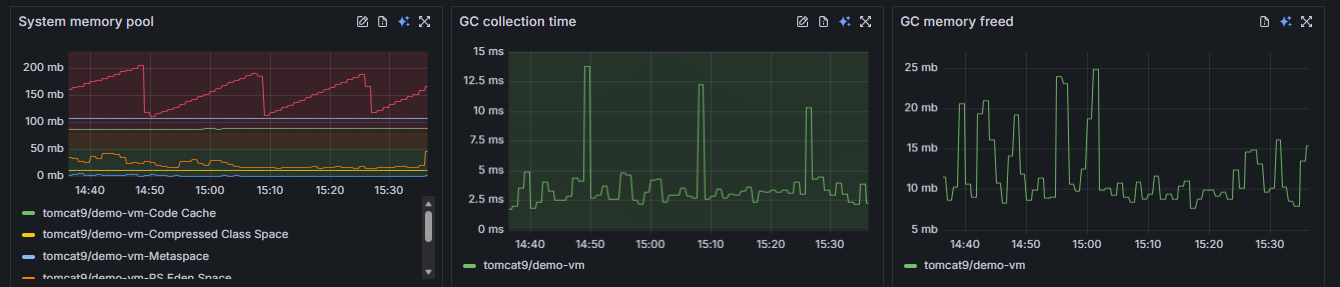
Every metric graph is fully interactive and designed for deep exploration. You can expand any graph, such as the System memory pool or JIT compilation time, into a large, focused view. The interface allows you to:
- Zoom and Navigate: Click and drag to zoom into a specific time window.
- Hover for Precision: Hovering over any line, such as a specific Tomcat instance in the memory pool graph, shows the exact value and timestamp.
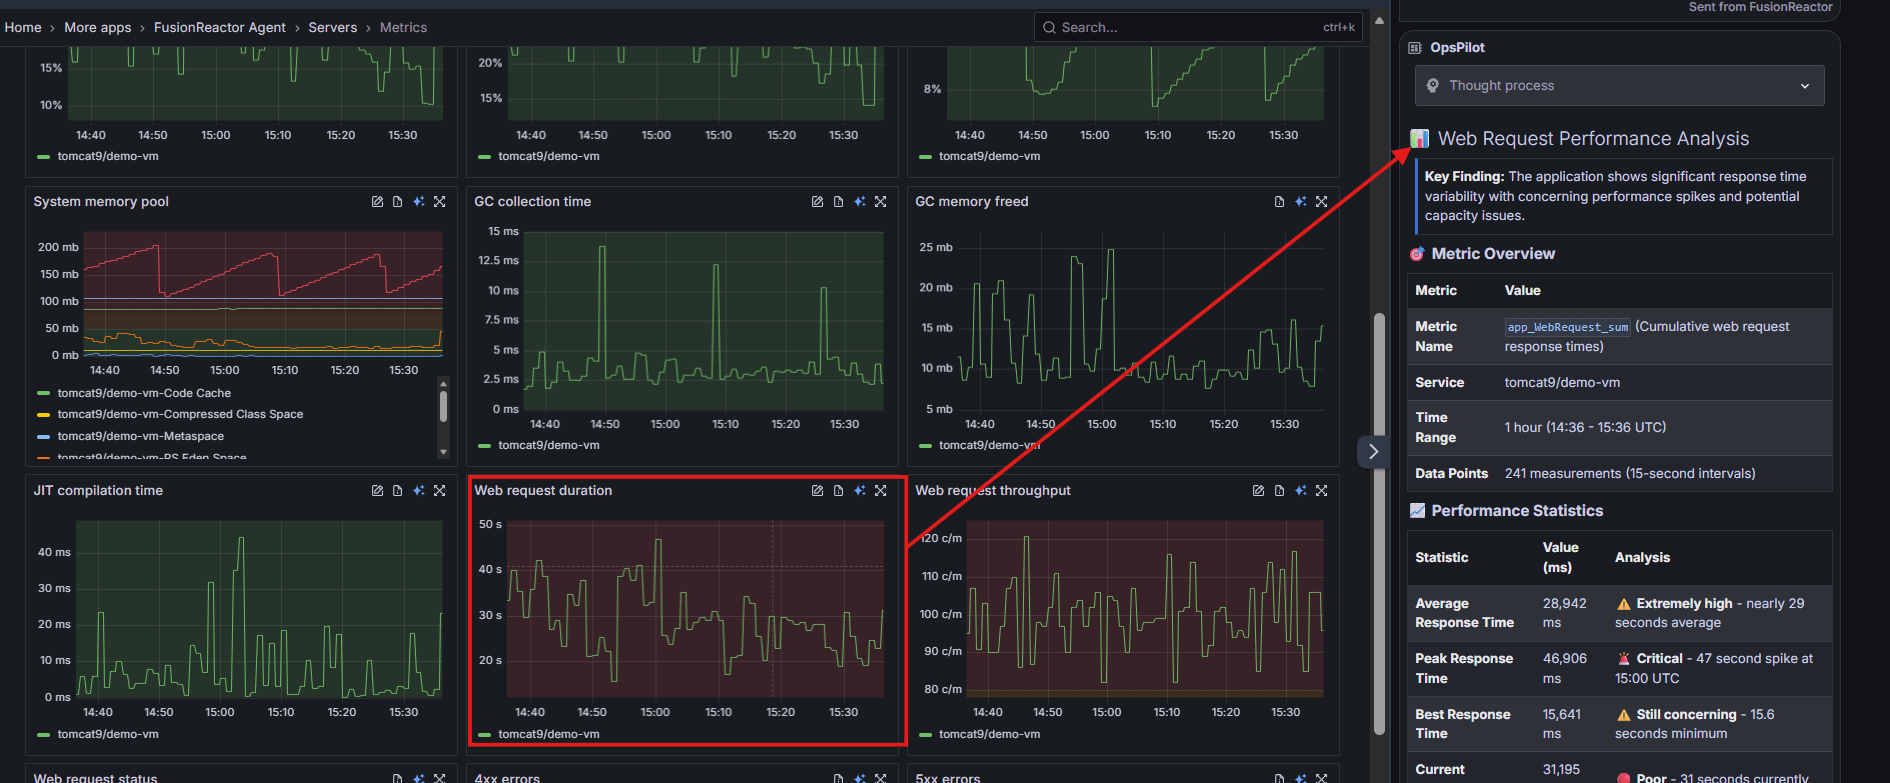
- Instant AI Diagnosis: On the right side of every expanded graph, you will see the blue AI icon. Clicking this sends the specific metric data directly to OpsPilot for immediate interpretation.
Correlate data effortlessly
The redesigned layout places all major categories of system behavior side by side. This makes pattern recognition effortless. For example, you might notice that a spike in GC collection time correlates perfectly with a rise in Web request duration. FusionReactor Cloud helps you see these connections immediately so you can find the root cause faster.
OpsPilot: AI insights for your metrics
When something looks wrong, but you cannot immediately explain it, AI can bridge the gap. With OpsPilot, you can send any metric or graph for instant analysis. It provides human-readable summaries of complex data, performance explanations for unexpected spikes, and guidance on next diagnostic steps. This moves you quickly from seeing a red tile or a spike in a graph to knowing exactly what caused the issue.
Centralized Metrics: One Dashboard for Complete Server Health in FusionReactor Cloud
To wrap up this look at the new Metrics Viewer, it is clear that monitoring at scale is no longer about managing complexity but about achieving clarity. By combining intuitive color-coded health states, fully interactive deep-dive graphing, and the proactive intelligence of OpsPilot, FusionReactor Cloud ensures you spend your time solving problems rather than just finding them. Whether you are overseeing a single instance or a global fleet, these tools provide the precision and speed necessary to maintain peak performance across your entire infrastructure.