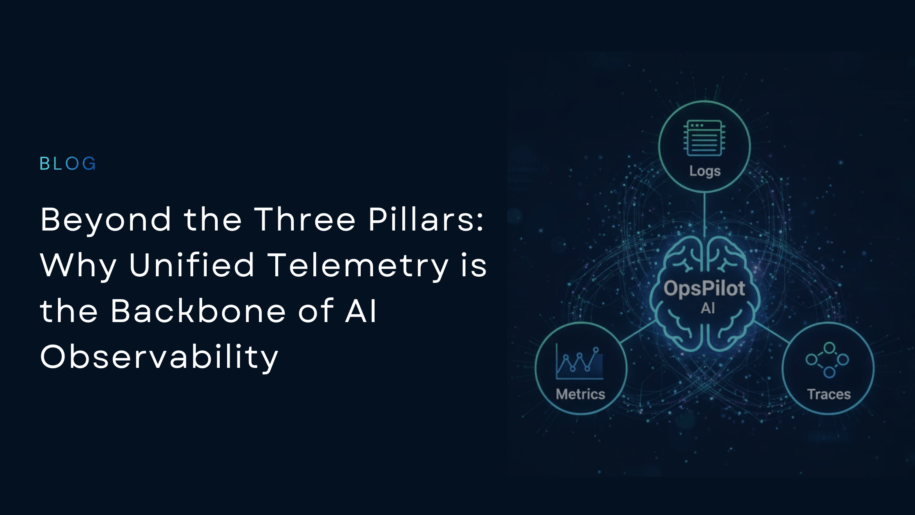
For years, the observability world has worshipped at the altar of the “Three Pillars”: Metrics, Logs, and Traces. But let’s be honest: in the heat of a production outage, these pillars often feel more like silos. You see a latency spike in your metrics, switch to a different tool to search for logs, and then manually copy and paste Trace IDs into a third dashboard to view the distributed trace.
This is “context switching,” and it’s the silent killer of MTTR (Mean Time to Resolution). At 3 AM, squinting at timestamps across three different browser tabs isn’t just exhausting – it’s inefficient.
At FusionReactor Cloud, we believe that for observability to be effective, it must follow one core principle: Everything is connected.
The Relic of “Separate Systems”
In the past, it was normal to have Graphite for metrics, Elasticsearch for logs, and a commercial APM for traces. They lived in different departments, used different naming conventions, and rarely spoke the same language.
FusionReactor Cloud breaks this cycle by using OpenTelemetry (OTel) as the universal translator. When your telemetry flows in, we don’t just store it; we weave it together using three critical dimensions:
1. Temporal Correlation (Time)
When a log error occurs at the exact millisecond a latency spike hits a metric, that’s not a coincidence. FusionReactor aligns your data on a consistent timeline, allowing you to see the “butterfly effect” of a single code change across your entire stack.
2. Resource Correlation (Space)
A log line, a span, and a metric might look different, but they often belong to the same “home” – a specific Kubernetes pod, a host, or a service. FusionReactor automatically enriches your logs with metadata like service.name and host.name. If you’re looking at a struggling pod, you instantly see every signal that pod is emitting, no searching required.
3. Trace Context (The Story)
This is the most powerful link. By using trace_id and span_id, FusionReactor connects the dots across microservices. When you open a trace, you see the logs associated with that specific request flow inline. It’s the difference between reading a book and trying to reconstruct a story from a shredded pile of paper.
Taking it a Step Further: From Connected Data to OpsPilot AI
Unified data is the foundation, but OpsPilot AI is the architect that builds the solution.
Many “AI” tools in the market are black boxes – they give you an answer, but you have to trust them blindly. OpsPilot is different. Because everything in FusionReactor is connected, OpsPilot acts like a “Power User” of your data.
When you ask OpsPilot, “Why is the checkout service failing?”, it doesn’t just guess. It:
- Scans the Metrics to find the anomaly.
- Pivots to the Traces to follow the request path.
- Inspects logs at the exact point of failure to identify the root cause.
The best part? It shows its work. OpsPilot presents its findings in a human-readable summary, but every conclusion is backed by the actual spans and logs it inspected. You can click into any part of the AI’s reasoning to see the data for yourself.
The Future is Conversational, but the Foundation is Unified
Good observability isn’t about having more data; it’s about the invisible threads that connect it.
By moving away from the “Three Pillars” siloed mindset and embracing a unified, OTel-native environment, FusionReactor Cloud doesn’t just show you that something is wrong – it tells you exactly where, why, and how to fix it.
Stop jumping between silos. Start seeing the whole story.


