
The days of manually digging through dashboards, correlating metrics across multiple tools, and piecing together performance clues are over. With OpsPilot’s AI-powered analysis capabilities, ColdFusion developers can now get intelligent, contextual answers to the most critical application health questions—instantly.
Instead of spending hours analyzing raw data, you can simply ask OpsPilot the right questions and receive comprehensive insights that include root cause analysis, impact prioritization, and actionable recommendations. Here are the five most critical questions every CF developer should be asking OpsPilot every day.
Why Ask OpsPilot Instead of Checking Dashboards?
Traditional monitoring requires you to:
- Navigate multiple dashboards and correlate data manually
- Interpret metrics without context or prioritization
- Guess at root causes based on limited information
- Spend valuable development time on detective work
OpsPilot transforms this process by:
- Cross-referencing data from FusionReactor, Prometheus metrics, Loki logs, and active alerts automatically
- Providing likelihood percentages for potential issues and solutions
- Delivering readable, digestible analyses instead of raw data dumps
- Creating comprehensive insights that mirror how senior developers think
Let’s explore the five questions that should become part of your daily routine.
Question 1: “OpsPilot, are there any errors or exceptions happening in my application?”
Why this is your first question every day: Errors directly impact user experience and often indicate underlying issues that can cascade into bigger problems.
What OpsPilot provides that dashboards can’t:
- Intelligent error categorization with impact analysis
- Root cause identification for complex exception patterns
- Cross-referenced analysis of related system events
- Prioritized action items based on error severity and frequency
- Context about whether errors are code-related, infrastructure issues, or external dependencies
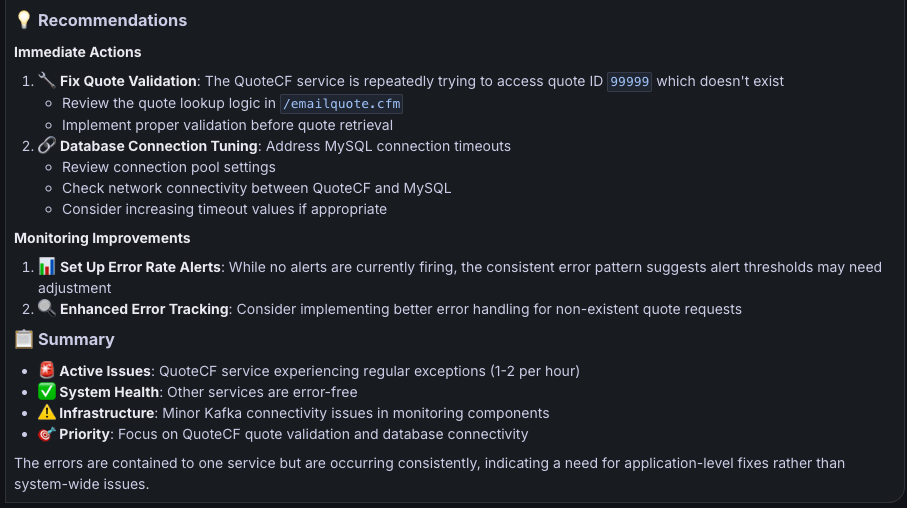
Example OpsPilot response: “Yes, there are active errors and exceptions occurring in your application, primarily in the QuoteCF service with some infrastructure connectivity issues. I’ve identified 1-2 CustomTypeException errors per hour consistently over the last 6 hours, specifically ‘Quote 99999 not available’ exceptions in /emailquote.cfm at line 34. Additionally, there are intermittent MySQL communication link failures with socket timeouts after 30 seconds. The QuoteCF service is repeatedly trying to access a non-existent quote ID, while other services (MyApplication AD and Fraud Detection) are running clean with zero errors. I recommend implementing proper quote validation before retrieval in the emailquote.cfm file and reviewing your MySQL connection pool settings to address the database timeout issues.”
Question 2: “OpsPilot, how are my response times performing?”
Why this question reveals critical insights: Slow responses often signal performance bottlenecks before they become complete outages.
OpsPilot’s intelligent analysis includes:
- Template-specific performance degradation identification
- Database query correlation with response time spikes
- JVM performance impact on CF template execution
- Trend analysis that predicts capacity issues
- Comparative analysis against historical baselines
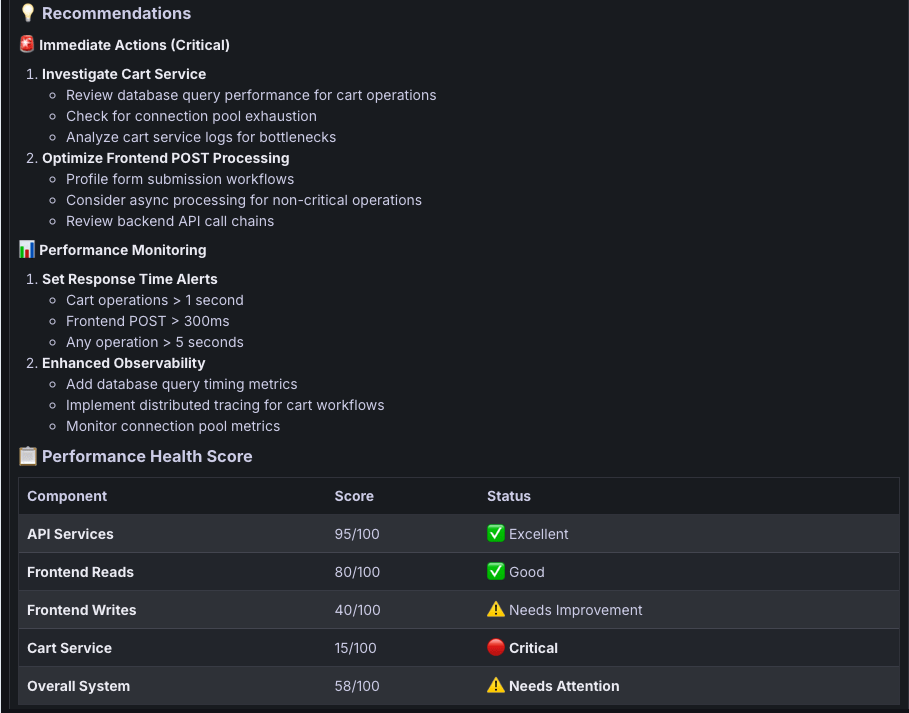
OpsPilot advantage: Rather than showing you average response times, OpsPilot provides contextual analysis: “Your applications show mixed performance with some concerning latency issues. API calls are excellent at ~5ms, but cart operations are critically slow at 3.3+ seconds for add item operations and 1.5+ seconds for get cart operations. Frontend POST requests are consistently slow at ~620ms average with 95th percentile reaching 750ms. The cart service performance is critically impacting user experience and likely causing abandonment. I recommend immediately investigating database query performance for cart operations, checking for connection pool exhaustion, and implementing response time alerts for cart operations over 1 second.”
Question 3: “OpsPilot, is my memory usage healthy?”
Why daily memory monitoring prevents disasters: ColdFusion’s memory-intensive nature means small leaks can quickly become application-killing problems.
OpsPilot’s comprehensive memory analysis:
- JVM heap usage trends with garbage collection impact assessment
- CF scope memory utilization (Application, Session, Request)
- Memory leak detection with probable source identification
- Capacity planning insights based on usage patterns
- Correlation between memory usage and application performance
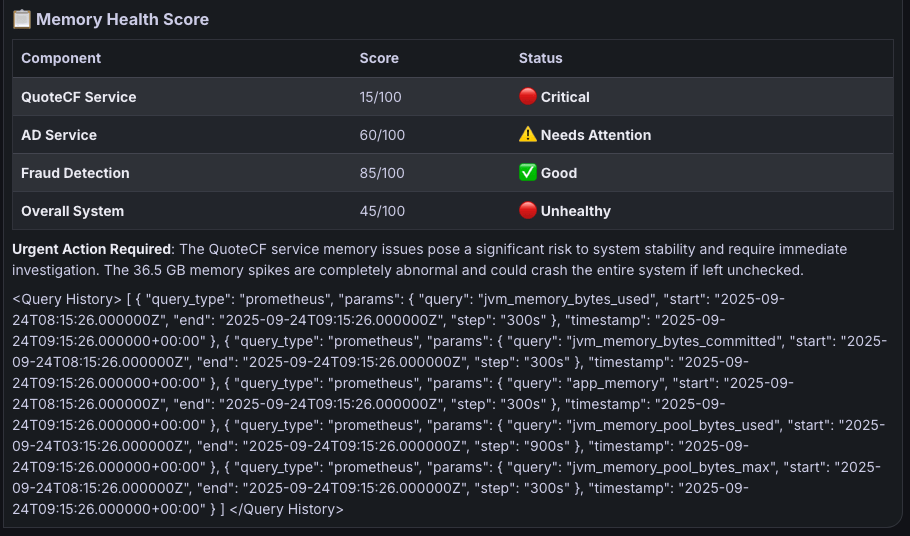
What OpsPilot reveals: “Your memory usage shows mixed health with some concerning patterns, particularly in the QuoteCF service which exhibits extreme memory spikes and potential memory pressure issues. The QuoteCF service shows critical problems with app memory spikes reaching 36.5 GB at peak (completely abnormal), heap memory volatility ranging from 365 MB to 1,056 MB within hours, and G1 Old Gen pressure fluctuating between 313-740 MB. Additionally, your AD Service has 96% utilization of tenured generation, indicating objects aren’t being garbage collected properly and risking OutOfMemoryError. I recommend emergency investigation of the QuoteCF memory leak, checking for unclosed resources or runaway processes, and immediately monitoring the AD Service tenured generation usage.”
Question 4: “OpsPilot, are my database connections performing well?”
Why database health is critical: Most CF applications are database-heavy, and connection issues create cascading problems throughout your entire stack.
OpsPilot’s database intelligence:
- Connection pool utilization analysis with bottleneck identification
- Slow query detection with performance impact correlation
- Database deadlock and timeout pattern analysis
- Connection health trends that predict capacity issues
- Service-wide impact assessment of database problems
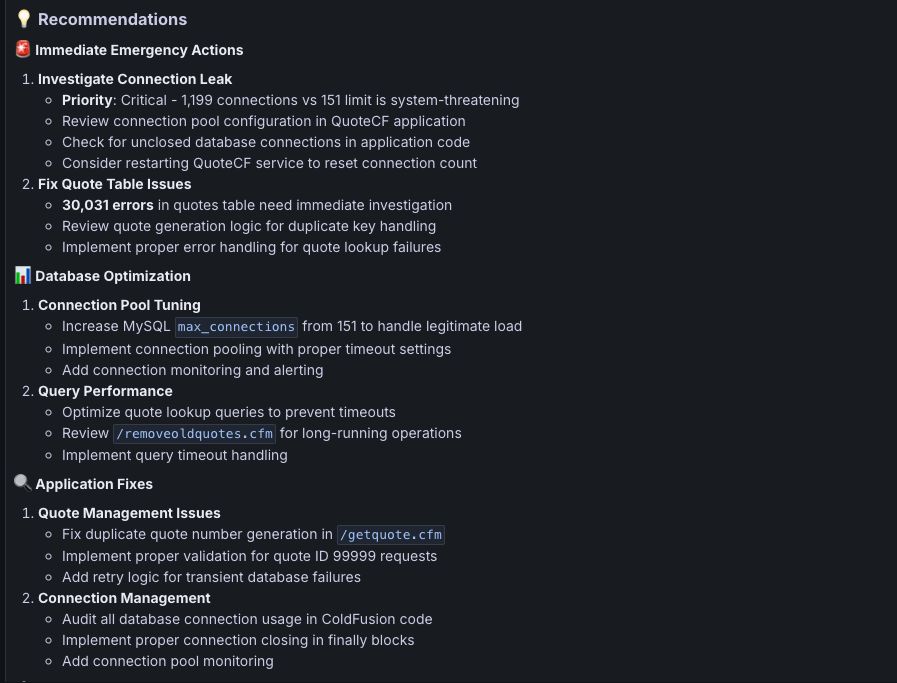
OpsPilot’s contextual insights: “Your database connections are experiencing severe performance issues with massive error spikes, connection timeouts, and rapidly increasing connection usage that’s approaching dangerous levels. I’ve detected 30,031 errors in the quotes table within just 5 minutes at 08:58 UTC, while your total connections have exploded from 118 to 1,199 connections in one hour – that’s 794% over your 151 connection limit. The errors include communications link failures with 30-second socket timeouts in /removeoldquotes.cfm, duplicate key violations for quote number ‘Q-2025-5869’ in /getquote.cfm, and repeated attempts to access non-existent quote ID 99999. This represents a critical system failure requiring immediate intervention to prevent total service outage – I recommend emergency investigation of connection leaks in your QuoteCF application and immediate restart of the service to reset connection count.”
Question 5: “OpsPilot, what’s my application throughput and capacity looking like?”
Why proactive capacity monitoring matters: Understanding load patterns helps prevent capacity-related outages and enables informed scaling decisions.
OpsPilot’s capacity intelligence:
- Traffic pattern analysis with peak usage prediction
- Resource utilization correlation across your entire stack
- Capacity headroom assessment with growth projections
- Performance degradation patterns under increasing load
- Bottleneck identification before they impact users
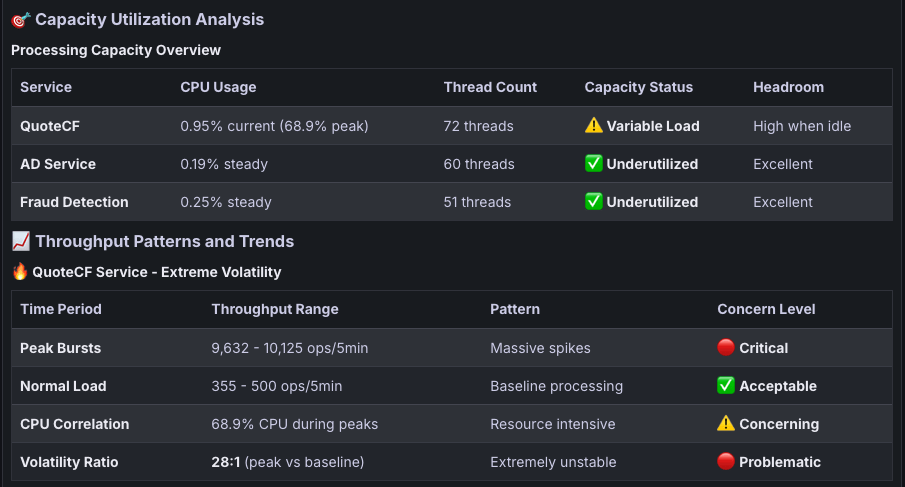
OpsPilot’s forward-looking analysis: “Your applications show extreme throughput variability with the QuoteCF service experiencing massive capacity swings from 355 to 10,124 operations per 5-minute window, while other services maintain steady, efficient processing rates. The QuoteCF service shows a 28:1 volatility ratio between peak and baseline performance, with throughput spikes reaching 10,125 ops/5min correlating with 68.9% CPU usage, while normal loads run at just 355-500 ops/5min. Meanwhile, your AD Service and Fraud Detection services are significantly underutilized with excellent headroom (0.19% and 0.25% CPU respectively). This extreme throughput instability indicates severe capacity management issues that make capacity planning nearly impossible. I recommend immediately investigating what triggers the massive QuoteCF throughput spikes, implementing load smoothing or queue-based processing, and considering resource rebalancing since other services have significant unused capacity.”
Beyond the Daily Five: Additional Questions for OpsPilot
Once you’ve established your daily routine, OpsPilot can provide insights into other critical areas:
“OpsPilot, are my scheduled tasks running successfully?” Get intelligent analysis of CF scheduled task performance, including failure pattern identification and impact assessment.
“OpsPilot, how is my overall JVM performance?” Receive a comprehensive JVM health analysis, including garbage collection optimization recommendations.
“OpsPilot, are my external service calls healthy?” Understand the performance and reliability of your web service integrations and third-party dependencies.
“OpsPilot, is my file I/O performing well?” Get insights into file system operations, document generation performance, and I/O bottlenecks.
The OpsPilot Advantage: From Data to Action
What makes these daily questions so powerful with OpsPilot is the transformation from raw monitoring data to actionable intelligence:
Traditional Monitoring Approach:
- Check multiple dashboards manually
- Try to correlate metrics across different tools
- Guess at root causes based on limited context
- Spend hours investigating before taking action
OpsPilot-Powered Approach:
- Ask one question and receive a comprehensive analysis
- Get cross-referenced insights from all monitoring sources
- Receive root cause analysis with confidence percentages
- Take immediate action based on prioritized recommendations
Making OpsPilot Part of Your Daily Workflow
Start your day with the “Critical 3”:
- “OpsPilot, are there any errors happening?” – Immediate crisis detection and impact analysis
- “OpsPilot, how are response times performing?” – Multi-service performance breakdown
- “OpsPilot, is memory usage healthy?” – System stability and memory leak identification
Then expand with the “Deep Dive 2”: 4. “OpsPilot, how are database connections?” – Infrastructure health and connection crisis detection 5. “OpsPilot, what’s our capacity situation?” – Throughput analysis and resource optimization
Integration with Your Development Workflow
OpsPilot’s enhanced capabilities mean these daily insights flow directly into your existing processes:
- Jira Integration: Critical issues automatically become tickets with comprehensive analysis
- Teams/Slack Notifications: Important insights appear where your team collaborates
- Executive Summaries: Technical details formatted for stakeholder communication
The Future of ColdFusion Troubleshooting
The real OpsPilot responses show that this isn’t just about proactive monitoring—it’s about crisis management and emergency response. The actual examples demonstrate OpsPilot detecting 30,031 database errors in 5 minutes, 36.5 GB memory spikes, and 28:1 throughput volatility ratios. These are emergency-level issues that traditional monitoring would present as raw numbers in dashboards, leaving developers to piece together the crisis on their own.
OpsPilot’s ability to cross-reference Prometheus metrics, Loki logs, and active alerts while providing contextual analysis means you’re not just monitoring your application—you’re having an intelligent conversation about its health with an AI that understands ColdFusion’s unique characteristics.
Get Started with Daily OpsPilot Questions
Ready to transform your troubleshooting workflow? These five questions can become part of your daily routine immediately. OpsPilot’s enhanced reasoning capabilities mean you’ll receive increasingly sophisticated insights as the AI learns your application’s patterns and performance characteristics.
The gap between traditional monitoring approaches and AI-powered intelligence is widening rapidly. While other teams manually correlate data and guess at solutions, OpsPilot users receive comprehensive analysis with actionable recommendations—every single day.
Try asking OpsPilot these questions today and experience the difference intelligent monitoring makes.
OpsPilot is now available to all FusionReactor Cloud customers, providing AI-powered insights that transform how ColdFusion developers troubleshoot their applications. Learn more about OpsPilot’s capabilities.


