FusionReactor Observability & APM

Monitoring an app is easy – until something breaks. That’s when alerting becomes the MVP of your observability setup. FusionReactor Cloud gives you deep insight into your applications, JVM, infrastructure, and ColdFusion workloads. But with hundreds of metrics to choose from, where do you start?
In this post, we’ll highlight 10 cool, actionable metrics from the FusionReactor Agent that you can configure alerts on right now to detect issues early, stay ahead of incidents, and optimize performance.
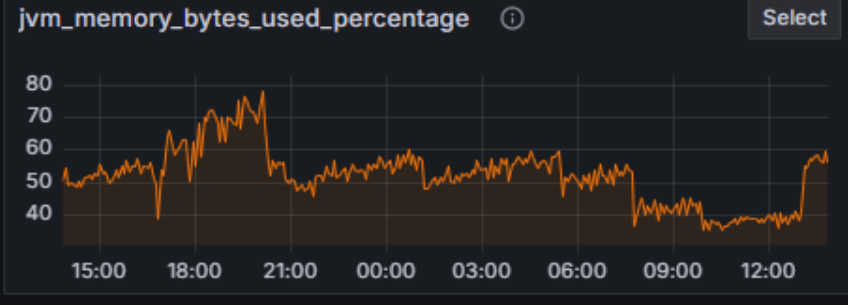
Why it’s cool: This gives you a percentage of how much of your JVM heap or non-heap memory is actually being used.
Alert use case: Trigger a warning at 70% usage and a critical alert at 90% – perfect for catching memory leaks before they crash your server.
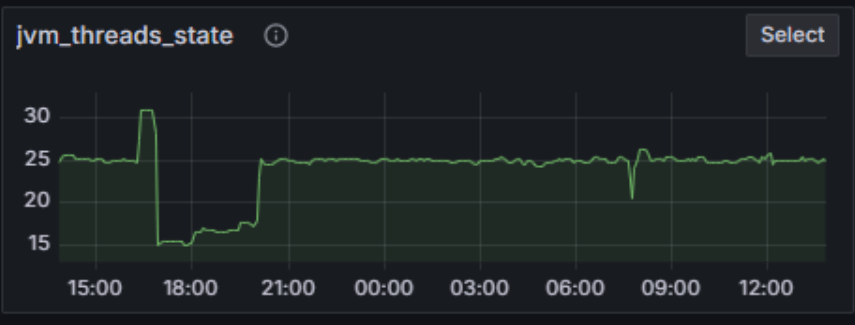
Why it’s cool: Threads stuck in BLOCKED or WAITING states could signal deadlocks or performance bottlenecks.
Alert use case: Alert if the count of BLOCKED threads exceeds a threshold for over a minute.
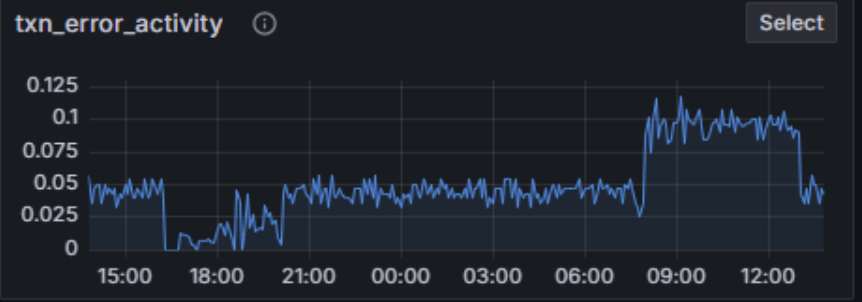
Why it’s cool: This tracks the number of transactions throwing errors per second, categorized by flavor (e.g., CFML, REST, WebRequest).
Alert use case: If error rates spike for a specific flavor, something just broke – time to investigate fast.
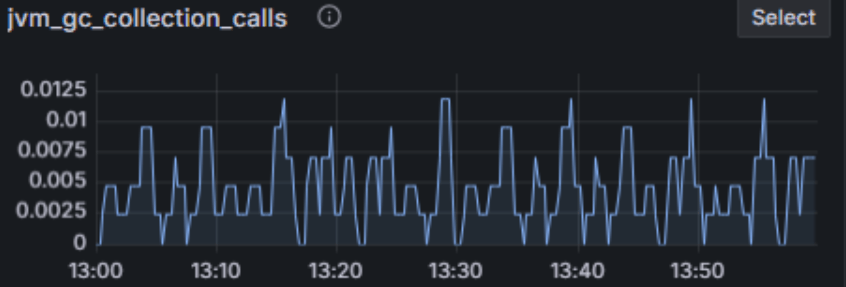
Why it’s cool: This tracks the number of garbage collections (GCs) over time. A sudden spike in GC frequency can signal memory pressure, inefficient allocation patterns, or misconfigured heap settings — especially under load.
Alert use case: Alert if GC call rate exceeds a known baseline (e.g., more than X collections/minute, depending on your app).
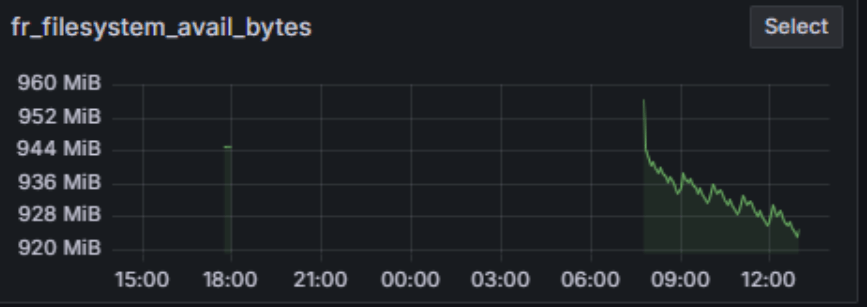
Why it’s cool: Running out of disk space? This metric monitors available bytes on your storage devices.
Alert use case: Set an alert when available space drops below 10%, especially critical in CI/CD environments or when dealing with log-heavy apps.
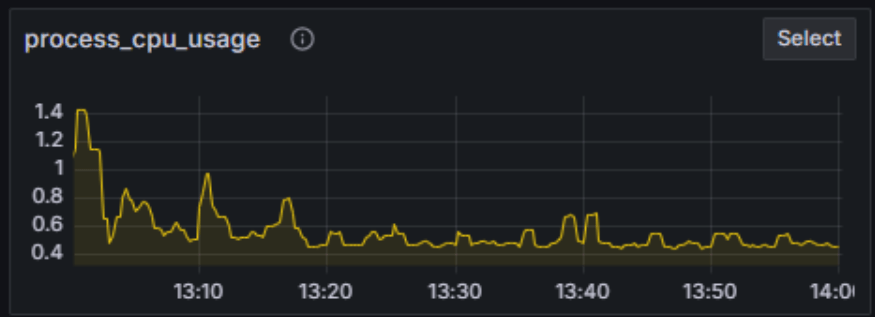
Why it’s cool: Overall CPU utilization across all cores and processes, directly from the system layer.
Alert use case: Great for high-level infrastructure alerts – know when your instance is maxed out, regardless of what’s causing it.
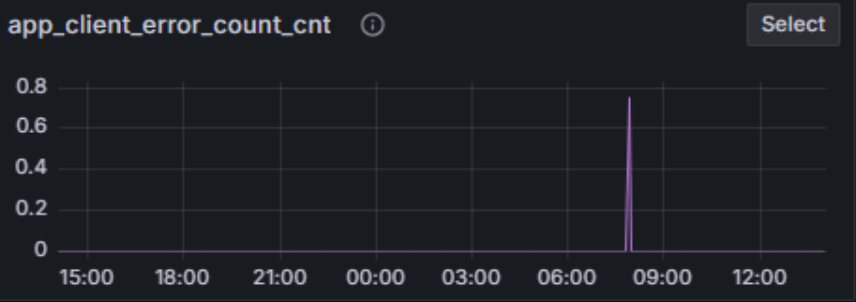
Why it’s cool: Tracks the number of 4xx HTTP responses per application per minute.
Alert use case: Alerting on an unexpected spike in client-side errors can help you spot broken links, bad requests, or frontend misconfigurations.
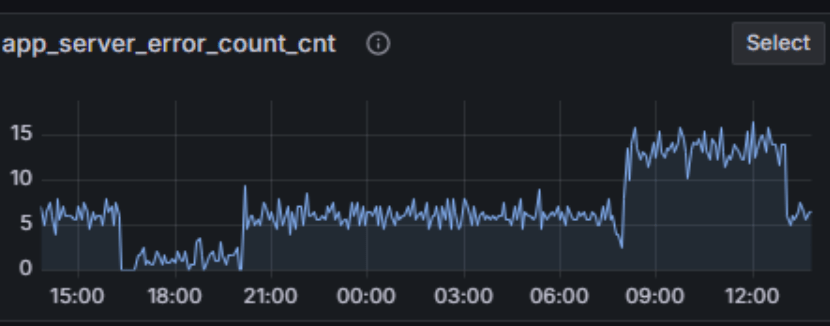
Why it’s cool: Unlike 4xx, this tracks 5xx responses – true server-side failures.
Alert use case: If these spike, your app is misbehaving. Create alerts for sudden increases in 500s to catch regressions fast.
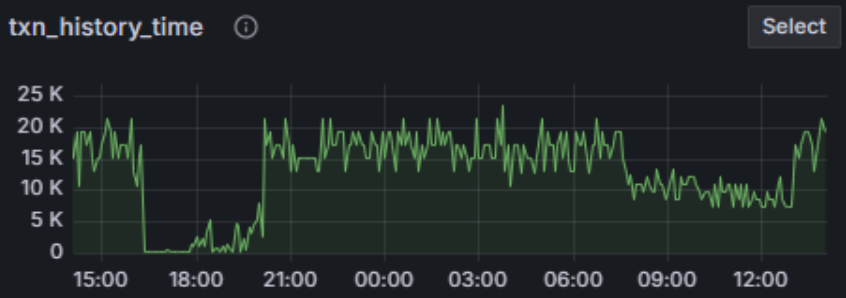
Why it’s cool: Shows the average duration of completed transactions per second (ms), broken down by transaction type.
Alert use case: Use it to detect performance regressions in specific APIs or transaction types. Alert on latency thresholds.
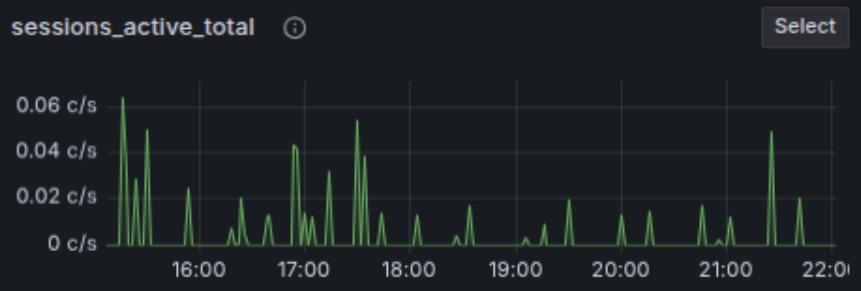
Why it’s cool: Tracks the total number of active sessions. Great for understanding user concurrency or session-related load.
Alert use case: Alert on sudden drops (indicating app failures) or unexpected spikes (possible abuse or bot activity).
All these metrics come with rich labels, like app_name, txn_name, status, or gc type – so your alerts can be filtered, grouped, and scoped for precision. Want to alert only on app_server_error_count_cnt for your critical production app? Just filter by app_name.
To begin configuring alerts, head over to the FusionReactor Cloud Alerting Docs or check out the Alerting UI. Set thresholds, define severity, and receive notifications via Slack, email, or webhook.


