At FusionReactor, we’re always looking for new ways to make your life easier, give you deeper insights, and help you run your applications with total confidence. We’ve been working on some exciting new capabilities – and we can’t wait to share what’s coming next!
🌍 OpenTelemetry Standard Agent
FusionReactor is getting even more flexible with our Otel standard FR agent. Easily send your data to Grafana, Datadog, and other popular APM tools – so you can keep working with the platforms you already love.
✅ More choice
✅ More flexibility
✅ Works with your existing tools
💳 One Simple Billing Model
Managing your plan is about to get much simpler. Our unified billing model supports on-premises, cloud, or hybrid setups, allowing you to switch between them easily.
✅ No billing headaches
✅ Freedom to adapt as your needs change
✅ Pay only for what you need
🖥️ Fresh Server & Application Views
We’re introducing new, modern ways to visualize your systems. The experience features clear and intuitive visualizations that enable users to quickly identify issues. With a cloud-based Control Panel, you’ll have easy access to your data from anywhere. Additionally, improved historical analysis will enable you to learn from past events and optimize your systems for the future.
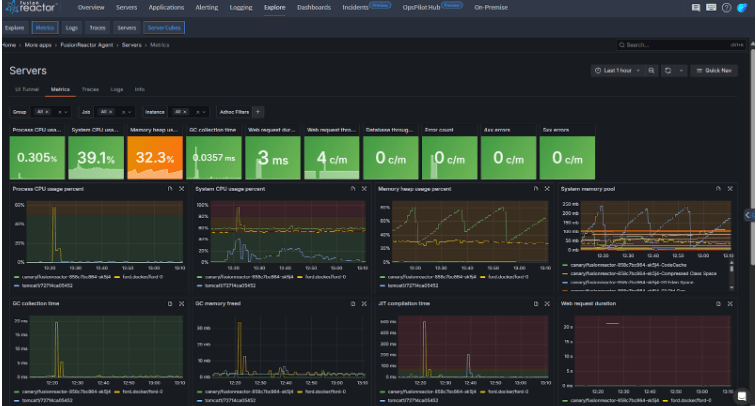
Server View
The Server View is an upcoming feature that will provide a centralized dashboard for monitoring and managing all servers in FR. Designed to resemble the Enterprise Dashboard, it will give a familiar and streamlined experience.
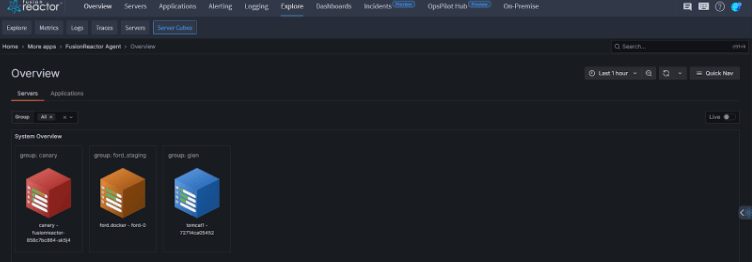
Once released, it will provide high-level visibility into server health, performance, and availability, with quick access to key metrics such as uptime, resource utilization, and active alerts. The centralized server dashboard lets you see all live servers in one place, with the ability to view both live and historical data for trend analysis. Users will also be able to filter, sort, and drill down into individual server details for deeper insights.
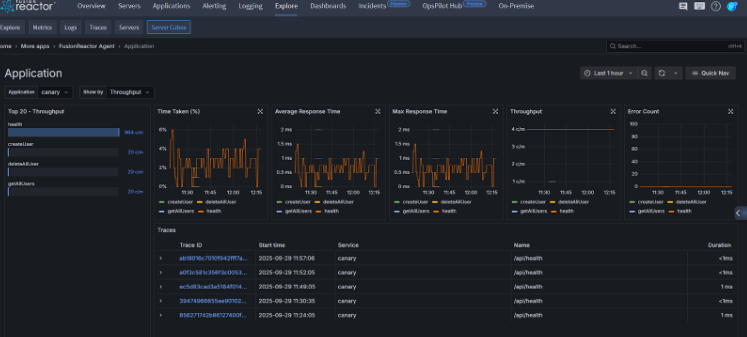
Application View
The Application View is an upcoming feature that will provide a centralized dashboard for monitoring applications within FusionReactor. Each application will be represented visually, with key performance metrics available at a glance. By clicking on an application, you’ll access detailed information such as transaction throughput (average, maximum, and per minute), error counts, and response times. This view is designed to mirror the Enterprise Dashboard style, giving you a consistent experience across both servers and applications, with clear, at-a-glance insights and drill-down capabilities.
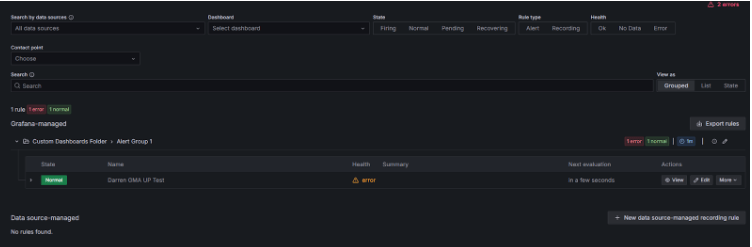
🔔 Smarter, More Powerful Alerting
Stay ahead of issues with our upgraded alerting system. You’ll be able to set alerts across any data source for total visibility into your environment, with support for multiple notification channels to reach your team wherever they work.
✅ Catch problems earlier
✅ Reduce downtime
✅ Full confidence that you won’t miss what matters
Seamless transition: Your existing alerts will migrate over automatically, so there’s no manual work required. Plus, silencers are back, giving you full control over when and how you receive notifications.
The Future of FusionReactor
At FusionReactor, our mission has always been to give you the clarity and control you need to keep your systems running smoothly. With these upcoming features, we’re taking a big step forward: simplifying the way you manage your environments, opening up new possibilities with industry standards like OpenTelemetry, and giving you modern, powerful views into the health of your servers and applications. Combined with smarter alerting and simpler billing, we’re making it easier than ever to focus on what matters most—delivering great experiences for your users.
This is just the beginning. The future of FusionReactor is about deeper insights, more flexibility, and total confidence in your applications. We can’t wait for you to see what’s next.
To find out what has been released, please check out our What’s New section in the docs.


