What is OpenTelemetry?
OpenTelemetry (also known as OTel) is an open-source observability framework made up of a collection of software tools, APIs, and SDKs which automatically collects telemetry data from across distributed IT environments and correlates it in real time, allowing users to quickly understand what is going on and why without having to predefine the exact data collected.
The Cloud Native Computing Foundation (CNCF) created OpenTelemetry as an incubator project to provide a standardized system for collecting, transmitting, and utilizing application telemetry data (i.e., metrics, logs, and traces) to monitor platforms and run analysis.
How OpenTelemetry Works
OpenTelemetry functions as a collection of free, open-source tools and APIs that is available for public utilization. Users can implement or develop vendor-neutral tools, APIs, and SDKs using languages like Go, Java, and Python. These tools define the necessary measurements, gather the required telemetry data, clean and arrange it, and export the telemetry data in the appropriate forms to a monitoring backend.
The pieces of OpenTelemetry are loosely connected, making it simple for all users to pick and choose any part of the OpenTelemetry framework they wish to integrate into their projects.
The main components of the OpenTelemetry framework include the following:
- Application programming interfaces (APIs)
APIs are essential to any large-scale software application because they transfer data between code and the outside world. APIs that are poorly developed expose your consumers to erroneous or partial information. As a result, implementing OpenTelemetry API helps research how to create APIs that meet your company’s requirements and compliance standards. APIs are also language-specific, so the API used must match the language of the code it is written with. - Software development kits (SDKs)
SDKs can be integrated into your program in various ways, such as middleware, an add-on for an existing framework, or a web browser plug-in. They can also be integrated into your workflow using an API management system. Through libraries that assist with data collection, processing, and exporting, SDKs implement and support APIs. - Data requirements
The data specifications are designed to provide a high-level overview of the data rather than a detailed definition of each field. Each field’s definition is given in great detail in the data model. The OpenTelemetry Data Model serves as the basis for the data requirements. Data specifications are verified using open-source software tools like DataSoother and DataTriage. The goal of the data model is to provide a high-level description of the data’s current condition so that it can undergo additional analysis. - OpenTelemetry Collector
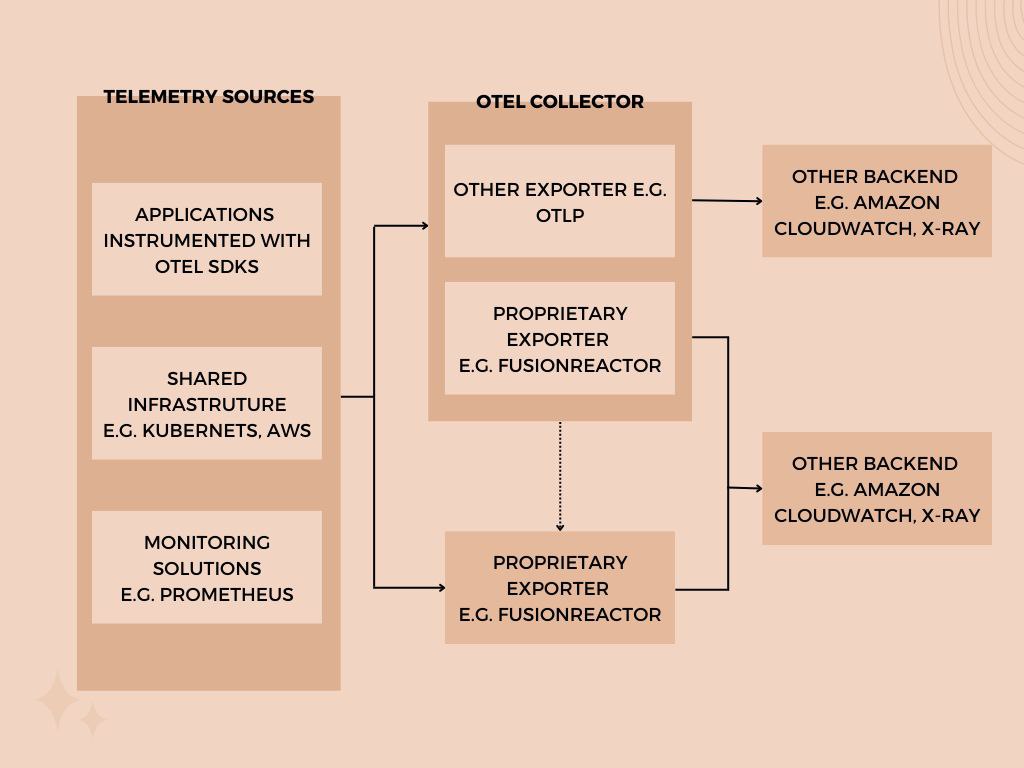
The Collector receives processes and exports telemetry data to backends. Its ubiquitous design enables it to function on a variety of commercial systems.
There are three components to the OpenTelemetry Collector:- The Receiver
The receiver specifies how information is gathered: either by sending information to the collector at regular intervals or by pulling it just when it is needed. The receiver can compile information from other sources if necessary. - The Processor
The processor carries out intermediary processes, such as batching and metadata addition, to prepare the data for export. - The Exporter
Depending on what the user specifies, the exporter delivers the telemetry data to an open-source backend. Like the receiver, the exporter can push or pull this data.
- The Receiver
What are the benefits of OpenTelemetry?
OpenTelemetry provides open-source tools to collect, analyze, and share telemetry data. Data collected by these tools are used to troubleshoot issues, increase productivity, and improve overall company performance. OpenTelemetry also provides tools that visualize and analyze telemetry data, such as charts and graphs, which display trends and provide insight into the telemetry data. Data visualization can provide information such as average and maximum telemetry values, failures and successes, etc.
Among the many advantages of OpenTelemetry include:
- Vendor Neutrality
Users can gather telemetry data from various services and distribute it to numerous platforms using OpenTelemetry without making significant configuration modifications. This enables users to share findings with their colleagues in the formats or tools that are most effective for them. To avoid vendor lock-in, OTel also allows consumers to send confidential data to alternative backends as needed. - Data Flexibility
Users can manage the telemetry data they provide to other platforms using OpenTelemetry. This ensures that each user only gathers the data they require, cutting down on wasteful spending. Furthermore, filtering makes it easy to apply unique tags to measurements for efficient categorization and searching. - Easy Setup
Organizations can save time by utilizing OpenTelemetry instead of studying individual technologies required for distinct apps in a stack or spending time constructing an internal solution. By not having to create new telemetry systems to support a change in a vendor or the addition of new tools to their system, users can also save effort on the part of their technical teams.
Challenges of OpenTelemetry
A problem with open-source telemetry tools is that it is a continuous process. The greater the amount of data collected, the more valuable the data becomes. And as data volumes increase, the possibility for data analysis and interpretation increases in various ways. The greater the value of the data, the more critical it is to make it actionable. Unfortunately, the bulk of telemetry systems does not give analysts the information they need to make informed judgments.
Other challenges of OpenTelemetry include:
- Language stability
Only a limited number of stable languages are supported by OpenTelemetry. Because certain languages are still in the experimental stage, they might not be able to collect all types of telemetry data, or they might need laborious manual instrumentation. - Data limitations
Additionally, some types of telemetry data are not fully supported. While distributed tracing, for instance, is entirely stable, many logging features are still developing. It’s also possible that specialized use cases like code profiling and application security are not offered. - Implementation and maintenance
You must make resources available for the OTel Collector and carry out regular maintenance procedures to keep it current if you want to use it as a commercial agent. Because of this, even though OpenTelemetry is a free, open-source solution, managing and running, it will still take time and effort.
Monitoring Tools and OpenTelemetry
To take advantage of OpenTelemetry’s robust data collection and routing features, it must be paired with an observability tool. When looking for an observability tool to use alongside OpenTelemetry, keep the following in mind:
Seamless integration among the three pillars of observability—metrics, traces, and logs—as well as between backend telemetry data and frontend session information
Alerts and insights based on machine learning for the rapid anomaly, outlier, and root cause discovery
Simple search and dashboard tools without the need to master a specific query language
Using a specialized exporter tool to collect data from the OTel Collector and deliver it to any backend location, or use a proprietary agent-based ingestion method to analyze, tag, and enrich your data without installing the OTel Collector.
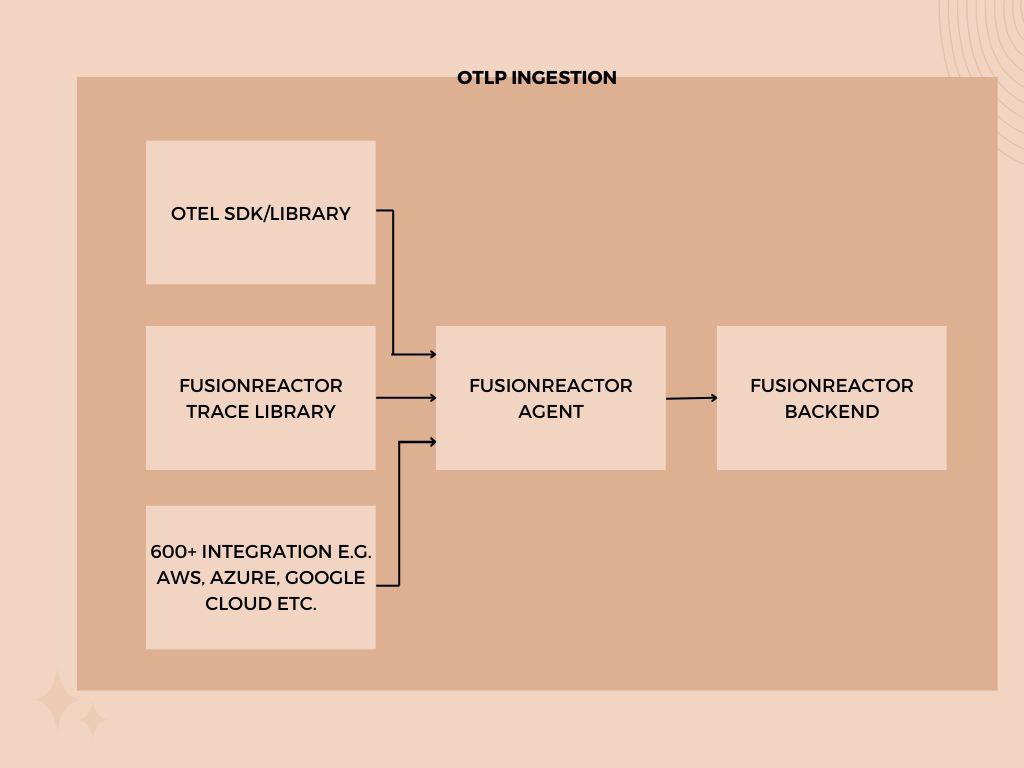
Your OpenTelemetry data can be collected, searched for, and analyzed more easily using FusionReactor. With full-stack visibility, you can see your system’s observability data in a single picture frame. Trace ID injection streamlines troubleshooting by linking users’ traces to their logs. Users may also instantaneously display, search, and analyze their data, enabling teams to work together and resolve problems across a stack. Users can efficiently acquire and transfer telemetry data from OpenTelemetry APIs and SDKs to the FusionReactor platform thanks to the FusionReactor Agent’s support for OTLP ingestion.


