
Imagine this: It’s the middle of the workday, and your application server suddenly crashes. Services are offline, users are frustrated, and you’re under intense pressure to find out what went wrong—and fast.
This is where FusionReactor Cloud becomes an invaluable ally. With powerful diagnostics, historic data retention, and AI-driven alerts, FusionReactor helps you investigate server crashes, pinpoint the root cause, and proactively prevent future incidents.
In this article, we’ll walk through a real-world crash scenario using FusionReactor Cloud, showcasing how its tools—such as metrics, traces, and logs—can help you transition from chaos to clarity in minutes.
The Advantage of FusionReactor Cloud
While both the Cloud and on-premises versions of FusionReactor offer robust diagnostic tools, the Cloud edition provides a key advantage: extended data retention.
- Historic Metrics: stored for 13 months
- Traces & Logs: retained for 30 days
This means you can investigate crashes after they’ve occurred, even if the server has since been restarted—no data lost, no blind spots.
Step 1: Spotting the Issue
In our example, we notice that Storefront 1 has been crashing repeatedly throughout the day.
To investigate:
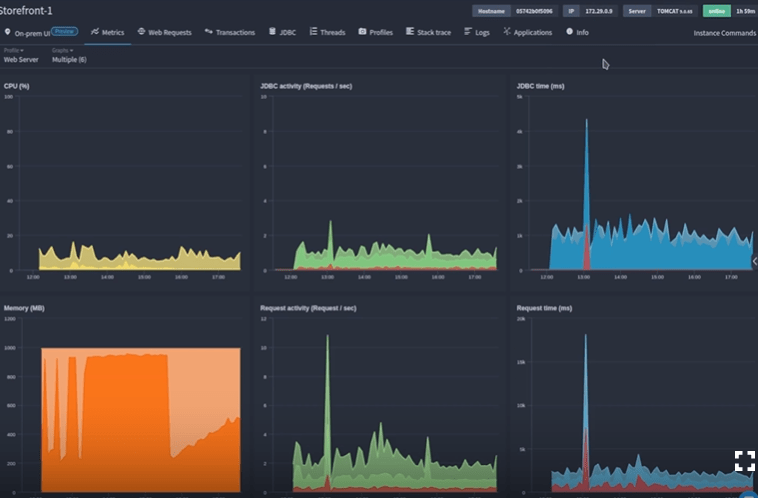
- Open the server in FusionReactor Cloud
- Toggle the Live Mode Clock to define a custom time range (e.g., the past 6 hours)
- The time filter syncs across all relevant data views: metrics, transactions, JDBC calls, and more
Immediately, the Used Heap Memory graph reveals troubling patterns: sharp spikes after each restart, followed by sudden drops—clear indicators of memory-related crashes. Just before the final crash, memory usage maxes out and doesn’t recover.
Step 2: Isolating the Root Cause
Zooming into the last spike gives us a closer view of what triggered the crash.
Heading to the Transactions tab:
- Select Saved in Cloud to view persisted transaction data
- Sort transactions by Duration
We quickly see that transaction times ballooned just before the crash. The normally fast Checkout file, which usually runs in 1–5 seconds, is suddenly taking much longer.
Then, a suspicious outlier appears: a request to Store Cache. On closer inspection, this transaction is consuming an unusually high amount of memory—far exceeding normal thresholds.
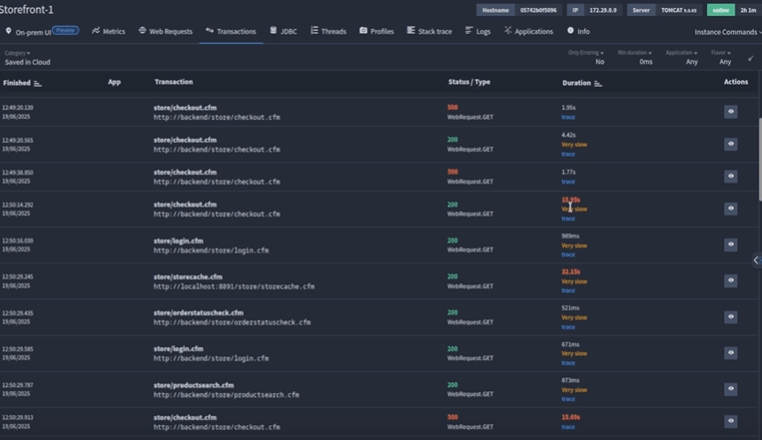
This perfectly aligns with the heap memory graph and explains the crash. Every time Store Cache runs, memory usage spikes, transactions slow down, and eventually the system crashes.
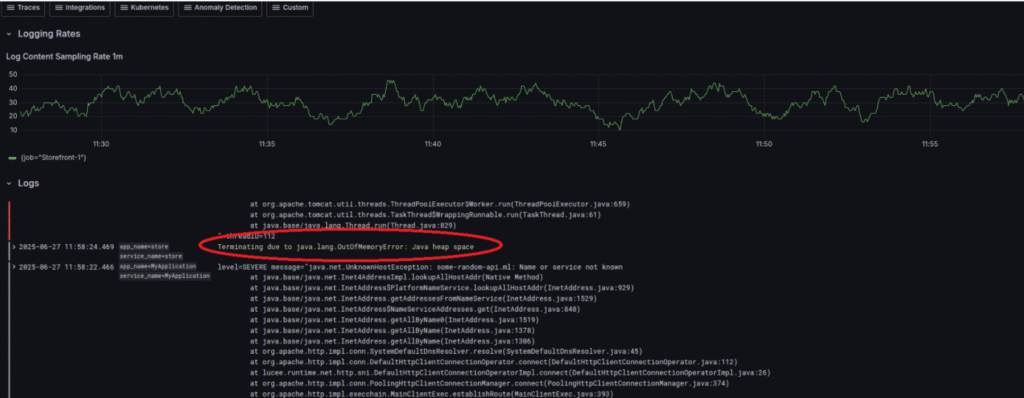
A review of server logs confirms it: an Out of Memory error was recorded just moments before the final failure.
Step 3: Preventing Future Crashes
Now that we’ve identified the issue, it’s time to make sure it doesn’t happen again. FusionReactor Cloud offers several proactive tools:
🔍 Anomaly Detection (AI Plan)
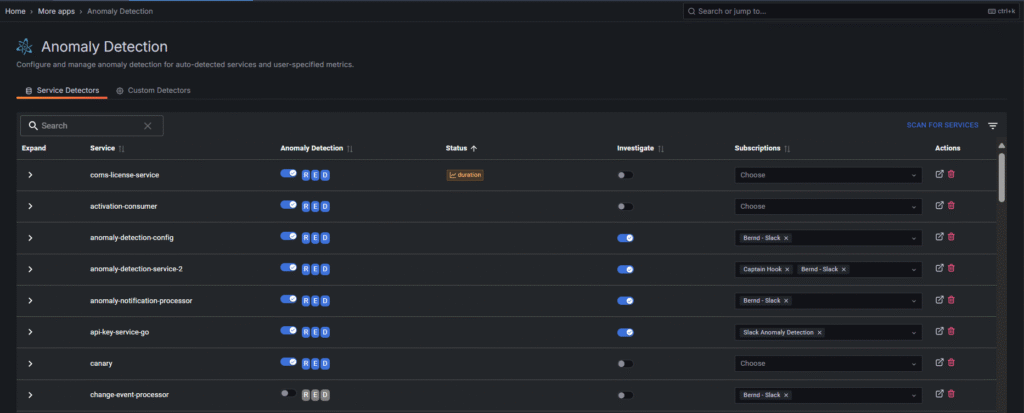
FusionReactor’s Anomaly Detection uses R.E.D. metrics (Rate, Error, and Duration) to flag unusual behavior.
- Automatically detects spikes in request volume, errors, or response times
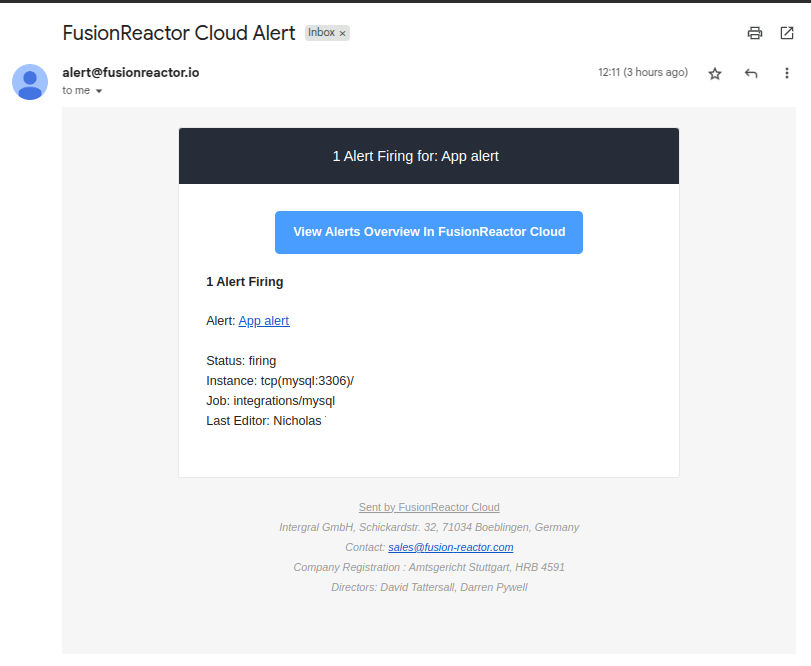
- Sends alerts via email or webhook (e.g., Slack, Teams)
- Adjustable sensitivity for fine-tuned monitoring
🚨 Alerting & Thresholds
The Alerting feature lets you define custom thresholds—for example:
- Memory usage exceeds a set limit
- Response times increase beyond acceptable bounds
- The server goes offline
You’ll get real-time alerts, keeping you informed and empowered to act quickly.
Conclusion: From Firefighting to Future-Proofing
With FusionReactor Cloud, crash recovery doesn’t have to be a guessing game. You gain:
- Deep historic visibility into system behavior
- Precision tools to identify the root cause
- Proactive monitoring and alerting to avoid repeat incidents
Whether you’re reacting to a crash or preventing the next one, FusionReactor Cloud helps you move from reactive firefighting to confident, data-driven decision-making.


