We have exciting news for the FusionReactor community: as of January 12, 2026, Anomaly Detection and Custom Dashboards are now available to all FusionReactor Cloud users across every plan tier.
These powerful observability capabilities, previously exclusive to higher-tier plans, are now included for everyone – from Starter to Advanced AI. This means every team using FusionReactor Cloud can now leverage intelligent monitoring and personalized visualization to detect issues faster and optimize their systems more effectively.
Anomaly Detection: Your 24/7 Performance Guardian
The Problem with Traditional Monitoring
Static thresholds don’t work in dynamic environments. Setting a CPU alert at 80% might make sense during business hours but could miss critical issues during low-traffic periods. Conversely, you might get flooded with false alerts during legitimate traffic spikes.
Manual monitoring simply can’t keep pace with the complexity of modern applications.
How Anomaly Detection Transforms Your Monitoring
FusionReactor’s machine-learning-based Anomaly Detection continuously learns your system’s normal behavior patterns across the Rate, Error rate, and Duration (RED) metrics. Instead of you defining what’s “wrong,” the system intelligently identifies when something deviates from established patterns.
Key Benefits:
- Early Issue Identification: Detect deviations from normal behavior before they escalate into critical incidents
- Reduced False Positives: The system adapts to your application’s unique patterns, dramatically reducing alert fatigue
- Proactive Problem Detection: Catch performance degradation during its early stages, not after users complain
- Around-the-Clock Vigilance: Anomaly Detection never sleeps, continuously monitoring your applications 24/7
- Context-Aware Alerting: Understand that “normal” varies by time of day, day of week, and seasonal patterns
Real-World Impact
Consider a typical e-commerce application. Traffic naturally spikes during lunch hours and evenings. Anomaly Detection learns these patterns and won’t alert you when response times increase during expected peak periods. However, if response times suddenly spike at 3 AM when traffic should be minimal, you’ll get an immediate alert – because that’s truly anomalous behavior for your system.
This intelligent approach results in fewer false alarms at night and faster detection of genuine issues.
Custom Dashboards: Visualize What Matters Most
One Size Doesn’t Fit All
Every team has different priorities. DevOps engineers need different views than database administrators. A microservices architecture requires a different visualization than a monolithic application. Your frontend team focuses on different metrics than your backend team.
Out-of-the-box dashboards provide a solid foundation, but true observability requires the flexibility to visualize your data your way.
The Power of Customization
Custom Dashboards let you create personalized views tailored to your specific needs, roles, and workflows. Build dashboards that surface exactly the information you need, when you need it, without the noise.
Key Capabilities:
- Role-Specific Views: Create dashboards for different team members – executives see high-level KPIs while engineers drill into detailed metrics
- Service-Focused Monitoring: Build dedicated dashboards for critical services or applications that need constant attention
- Flexible Visualization: Choose from multiple graph types, configure time ranges, and arrange panels to match your workflow
- Quick Problem Identification: Group related metrics together to spot correlations and identify root causes faster
- Shareable Insights: Collaborate effectively by sharing custom views with team members or stakeholders
Use Cases That Drive Value
For DevOps Teams: Create a dashboard combining deployment frequency, error rates, and response times to track the health of your CI/CD pipeline and quickly identify problematic releases.
For Database Administrators: Build a focused view of database connection pools, slow queries, and transaction volumes to optimize database performance without sifting through unrelated application metrics.
For Business Stakeholders: Design executive dashboards showing user experience metrics, transaction volumes, and service availability – translating technical performance into business impact.
For Incident Response: Construct war room dashboards that consolidate critical metrics for your most important services, enabling faster triage during incidents.
Integration with FusionReactor’s Full Observability Platform
These features don’t exist in isolation – they integrate seamlessly with FusionReactor’s comprehensive monitoring capabilities:
- Distributed Tracing: Combine anomaly alerts with trace data to immediately understand the request flow causing issues
- Log Analysis: Jump from an anomaly detection alert directly to relevant logs to understand the context
- OpsPilot AI: Ask OpsPilot natural language questions about detected anomalies or create queries based on your custom dashboard insights
- Alerting Integrations: Send anomaly detection alerts to Slack, Microsoft Teams, or Jira for immediate team visibility
Getting Started Today
Both features are already enabled in your FusionReactor Cloud account – no configuration changes or upgrades required.
Enable Anomaly Detection
- Navigate to your service in FusionReactor Cloud
- Access Anomaly Detection settings
- Configure sensitivity levels and alert channels
- Let the system learn your baseline patterns (typically 1-2 weeks for optimal accuracy)
Create Your First Custom Dashboard
- Go to the Dashboards section in FusionReactor Cloud
- Click “Create Dashboard”
- Add panels with the metrics most relevant to your workflow
- Arrange, resize, and configure visualizations
- Save and share with your team
Available Across All Cloud Plans
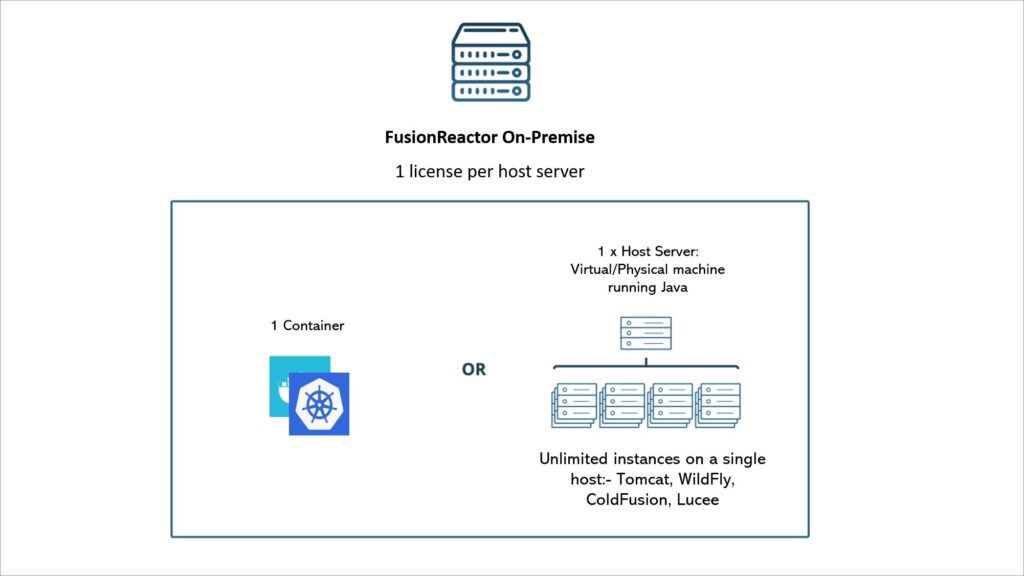
FusionReactor APM
Comprehensive Java and ColdFusion monitoring
Each seat covers 1 host with up to 4 app instances or Docker containers
Starter Cloud
10K Metrics + 25GB logs + 25GB traces + 500 OpsPilot Tokens
Pro AI Cloud
20K Metrics + 100GB logs / traces + 5000 OpsPilot Tokens
Advanced AI Cloud
50K Metrics + 250GB logs / traces + 20000 OpsPilot Tokens
By making these features universally available, we’re enabling every FusionReactor Cloud user to:
- Reduce Mean Time to Detection (MTTD): Catch issues before they impact users
- Decrease Alert Fatigue: Focus on genuine problems, not false positives
- Improve Team Efficiency: Give everyone the exact view they need of system health
- Make Data-Driven Decisions: Visualize trends and patterns that inform optimization efforts
- Enhance Collaboration: Share consistent views across teams for better communication
What Our Users Are Saying
“We recently moved to the Cloud + AI platform and it has more features than we know to use. We’re still in the process of learning the ropes, but it provides with a more holistic view of our infrastructure compared to our old on-prem deployments.” – Verified G2 Reviewer
“The primary use we have for it is that it’s allowing us to track down bad performing parts of our applications and identify areas of improvement either in code, resources or configurations.” – Verified G2 Reviewer
Part of Our Commitment to Excellence
This expansion continues FusionReactor’s tradition of delivering exceptional value. As a five-time G2 award winner with consistent recognition for Best Support, Fastest Implementation, and Best ROI, we’re committed to ensuring every customer – regardless of plan size – has access to the tools they need for successful observability.
Ready to Experience the Difference?
If you’re already a FusionReactor Cloud user, log in today to start using Anomaly Detection and Custom Dashboards. Not yet on FusionReactor Cloud? Start your free trial and experience the full power of intelligent, customizable observability.

About FusionReactor: FusionReactor is a comprehensive observability platform providing full-stack monitoring, distributed tracing, AI-powered insights, and now universally available anomaly detection and custom dashboards. Trusted by organizations worldwide and recognized with many G2 awards across multiple categories over the last 5 years.