
Modern distributed systems produce an overwhelming volume of signals – metrics, logs, alerts – and when something goes wrong, finding the why behind the what is everything. With OpsPilot’s new trace analysis capabilities, your AI assistant can now go beyond surface-level anomalies and drill directly into individual transactions to uncover the root cause.
This is a game-changer for reliability and performance engineering.
Enhanced investigation capabilities
1. Request-level visibility
OpsPilot can now inspect individual traces and requests across your services, providing full contextual understanding.
- Search for traces that match key criteria such as:
- Errors
- Slow response times
- Specific endpoints or services
- Errors
- See the full execution path showing how a request flows across microservices
- View service timings, attributes, and interactions at each hop
Instead of guessing what happened, OpsPilot now shows you the exact request that went wrong.
2. Root cause analysis, accelerated
Metrics tell you something is wrong—traces now tell you why.
- Identify where latency spikes occur across service boundaries
- See breakdowns by span to pinpoint bottlenecks
- Spot failures, retries, and timeouts hidden deep in distributed transactions
OpsPilot automatically correlates problem metrics with trace queries, enabling a seamless workflow from symptom → cause → resolution.
3. Complete request lifecycle intelligence
OpsPilot connects your macro-level visibility (metrics) with micro-level insight (traces):
Signal Type | Question Answered | Example |
Metrics | What is happening? | “Error rate is spiking on the checkout endpoint” |
Traces | Why is it happening? | “Payments service is timing out due to a database lock” |
With span-level metrics aggregated across all requests, OpsPilot gives you trend visibility, and with trace querying, it can zoom in on specific transactions to explain anomalies.
Available trace tools (Powered by Tempo)
These new capabilities come from the Tempo integration inside OpsPilot, enabled by the following trace tools:
Tool
Purpose
list_tempo_tag_keys
Discover trace attributes such as service names, HTTP methods, and status codes
list_tempo_tag_values
View all possible values for selected trace attributes
search_tempo_traces
Query Tempo using TraceQL to filter by duration, service, status, and time window
get_tempo_trace_by_id
Retrieve full trace data with all spans, timings, and metadata for review
Together, these allow OpsPilot to automatically:
- Discover services involved in problematic traces
- Perform focused searches for symptoms (e.g., “show traces with status=500” or “duration > 2s”)
- Drill into individual trace IDs for complete investigation
Why this matters for OpsPilot users
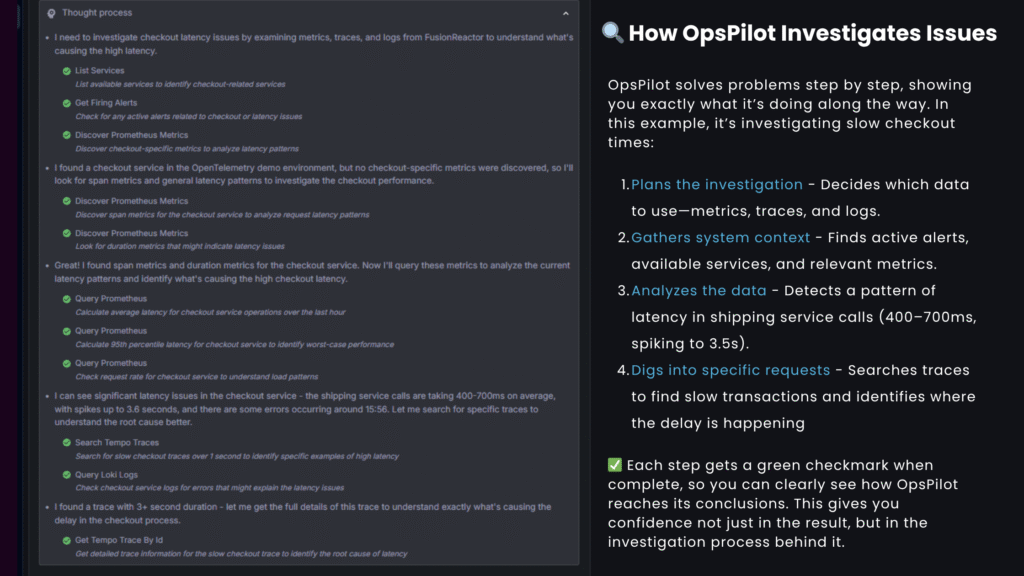
Previously, OpsPilot could alert you to anomalies using metrics. Now, it can investigate them just like a human SRE:
- Ask OpsPilot: “Why is checkout latency high?”
- OpsPilot pulls metrics → identifies problem service → queries relevant traces → inspects execution path → provides root cause.
- You get answers, not data.
OpsPilot doesn’t just observe your system. It understands it.
The Future of AI-driven operations
Tracing is the missing link between knowing a problem exists and understanding its cause. With these new trace tools, OpsPilot becomes your intelligent incident investigator – capable of navigating distributed systems, piecing together failure scenarios, and surfacing the exact insight you need to fix issues faster.
Less time searching. More time solving.
Ready to try it? Ask OpsPilot any question about system performance and let it trace the truth.


