One of the metrics gathered by FusionReactor during the execution of a transaction (request) is the memory usage of the transaction. This is displayed on the Main tab in the transaction details page. Since FusionReactor 6 we have added the Transaction Allocated Memory value to these details. All of these numbers can be a little confusing so below we have explained what all the memory values mean.
The first few numbers are quite straight forward. These are simply a snap shot of the JVM state at either the start of the transaction (for transactions that are still running), or at the end of the transaction (for transactions that are finished).
Used Memory
This is the amount of memory that is currently used by the JVM, shown as both a absolute byte value and as a percentage of the maximum memory.
Free Memory
This is the amount of memory that has not been allocated by JVM. i.e. max memory minus allocated memory.
Transaction Allocated Memory
This value needs some deeper explanation in order to avoid confusion. This number is the total number of bytes that have been allocated during the life time of the transaction. Every time an object is created a portion of the JVM memory is used to hold this object, of course in java the garbage collector (GC) will automatically free any memory that is no longer needed.
This means that you can the reuse the same memory space again. So if we run the bit of code below, we will allocate memory space the string 10 times. Resulting in the transaction allocated memory value being 10 times the size of the single string.
for(int i = 0; i < 10; i++)
{
String str = "this is a string";
}
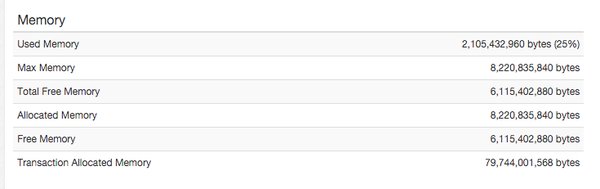
This would mean that even if you have a max heap of 8 gigabyte the transaction allocated memory value can exceed this value. This would indicate that JVM is allocating and then freeing lots of object. If we look at the image below you can see that a single transaction can allocate more than the maximum heap, as long as it does not do it all in one go.