Recently we were asked if we had specific integration for openmetrics to send information to FusionReactor Cloud. While we don’t have support for openmetrics specifically we do have an API where any metrics can be posted from the FusionReactor instance.
There 2 stages of getting this working. Firstly you need to use FRAPI to post a metric every second / minute for your custom series and the second part is configuring the cloud graph profile to show this data.
Posting Metrics
To post metrics to the cloud, the metrics first need to be published into FusionReactors metric system.
final long end = System.currentTimeMillis() + 60 * 60 * 1000;
while (System.currentTimeMillis() < end)
{
FRAPI.getInstance().postNumericAggregateMetric(
"/com/test/jsp/series",
(float)Math.random() * 100);
Thread.sleep(1000);
}
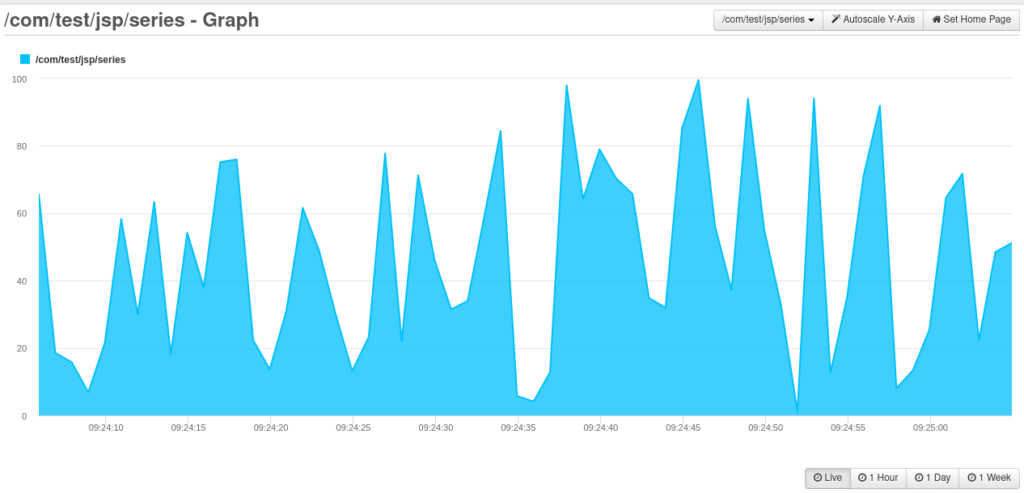
FusionReactor will then allow this to be seen via the Custom Metrics page.
E.g.
Now you have data being captured in FusionReactor, you have to configure it to send the data to the cloud.
To do this you simply need to create a file called custom_series.txt. This file needs to contain the name of the series.
E.g.
$ cat /opt/fusionreactor/instance/tomcat8/custom_series.txt
/com/test/jsp/series
Where my instance is running from the instance directory /opt/fusionreactor/instance/tomcat8/
You have to restart your server for this file to be read. Once you do and the postNumericAggregateMetric API is being called reliably, the data will be sent to the cloud.
Configuring Cloud Graph Profile
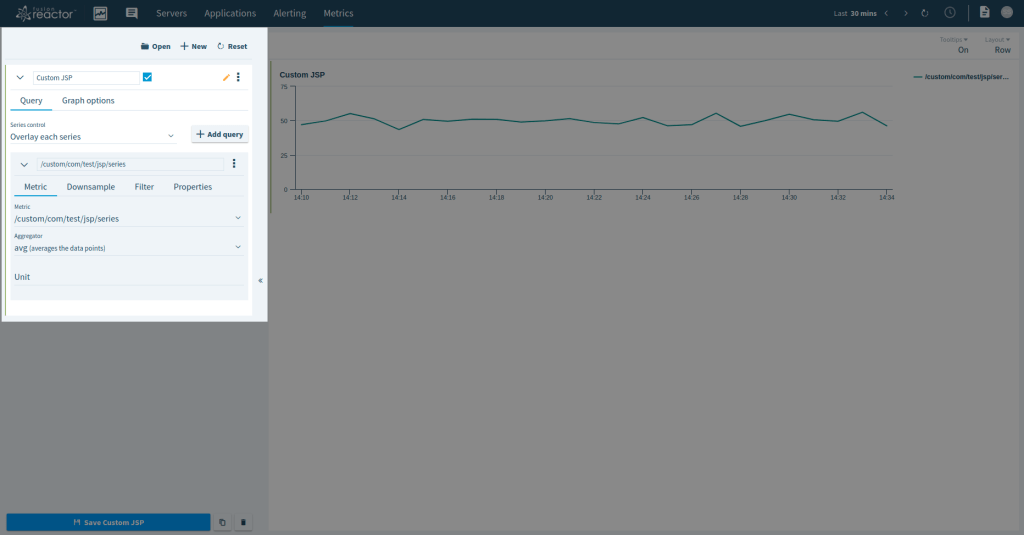
To get the custom metric to appear in a graph you have to use the Metrics Explorer. You can get to this by clicking the “Metrics” menu from the top navbar in the Cloud.
You then need to create a new graph by clicking “New”, give it a name, and select the custom metric. All custom metrics are prefixed with /custom/ and then have the series id.
To get this graph to be usable as a template you have to select the “Filter” tab, select the tag option “server”, function option “literal_or” and the value option should be your server, then finally select the “Save as a template” checkbox.
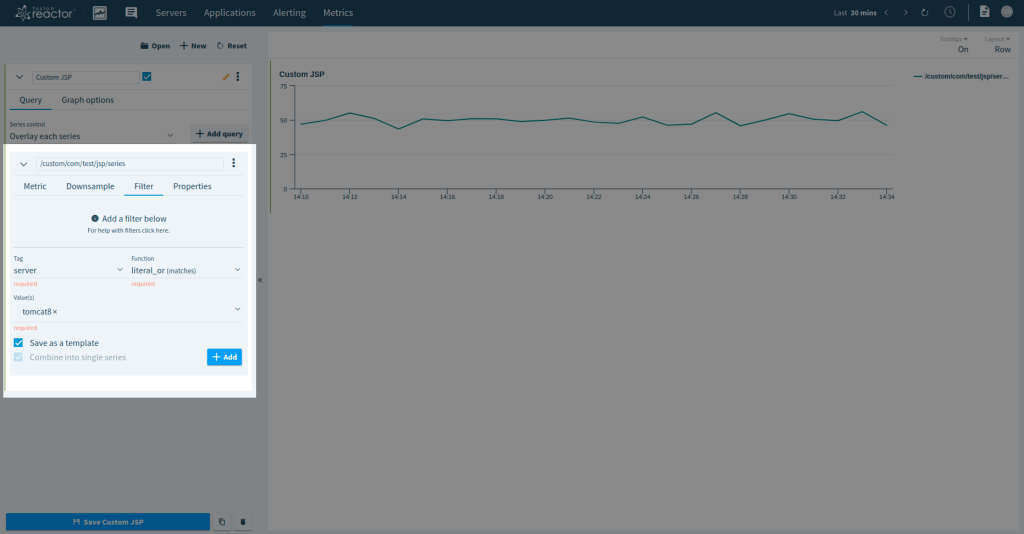
Now press the “+ Add” button to add this filter.
To save this graph click on the vertical ellipsis in the top right and select “Save”
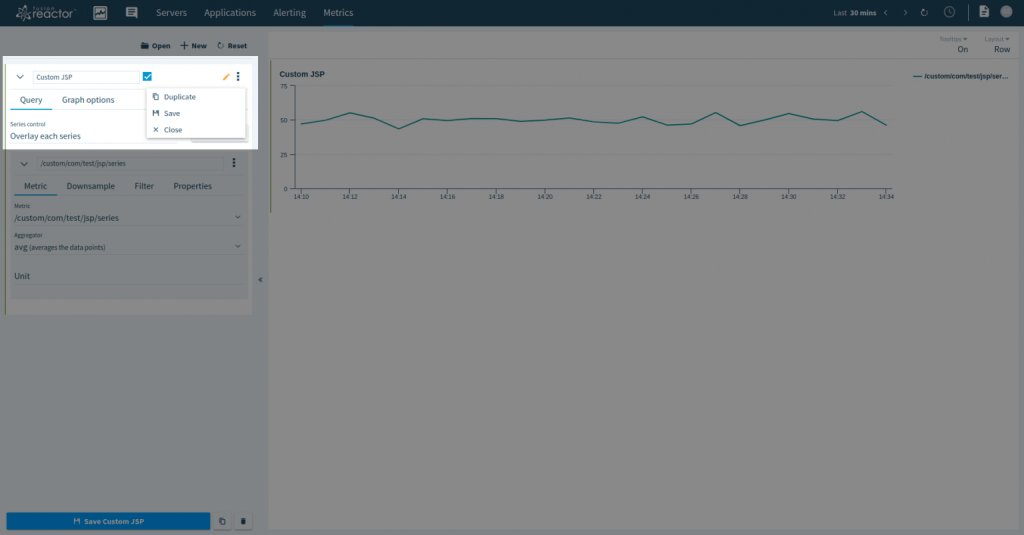
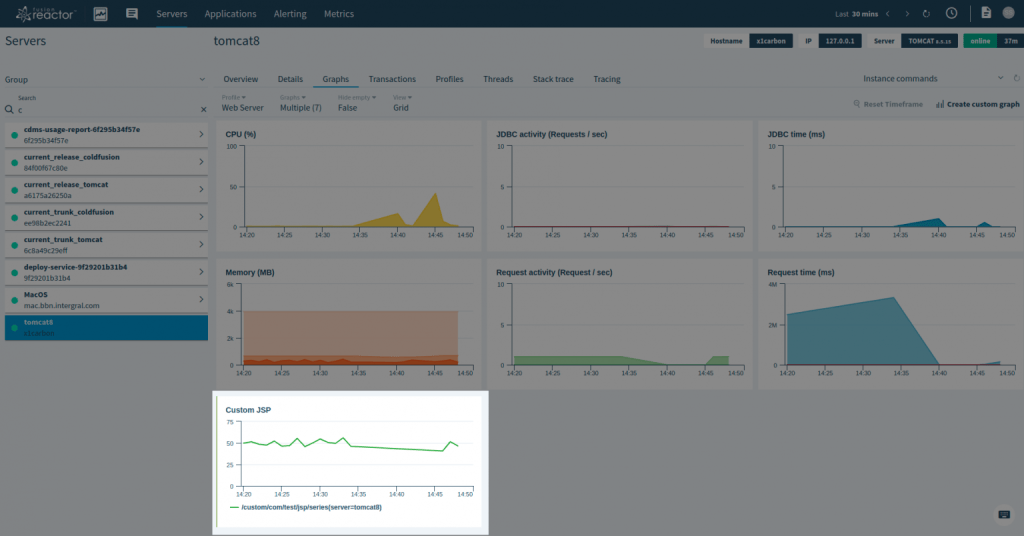
If you go to the Server view and view the graphs, you can now select the graph you have created and it will appear with the other graphs in the current graph profile.
The graphs shown are available under the “Graphs” filter menu.
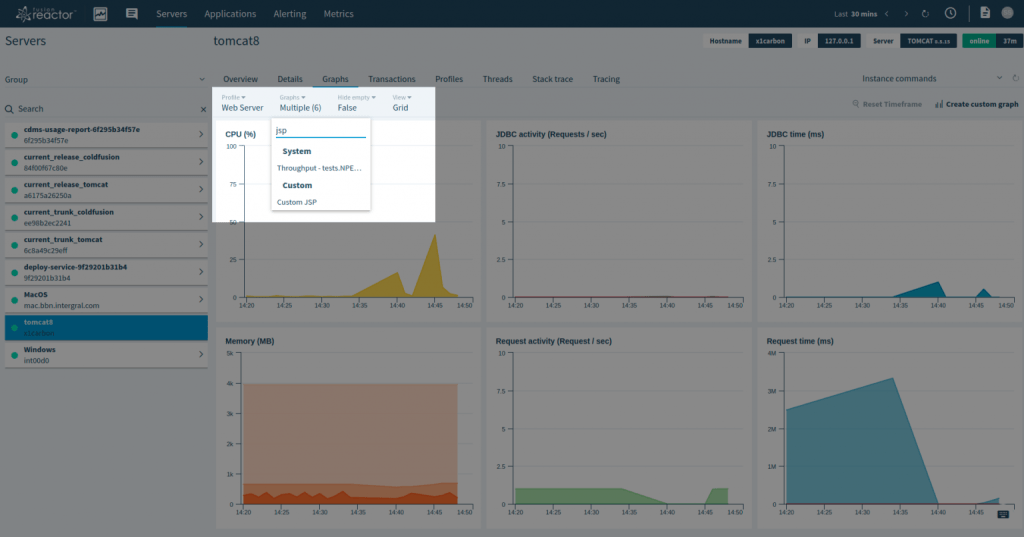
Custom graphs are appended to the bottom of this menu. Once your graph is selected it will appear.
