How to view historical data in FusionReactor Cloud
FusionReactor Cloud provides powerful tools to view and analyze historical data, allowing you to maintain visibility over your application’s performance and troubleshoot issues effectively. Up to 13 months of metric data and up to 30 days of trace and log data are stored in the Cloud. Here’s a step-by-step guide on how to access and use historical data.
Servers view
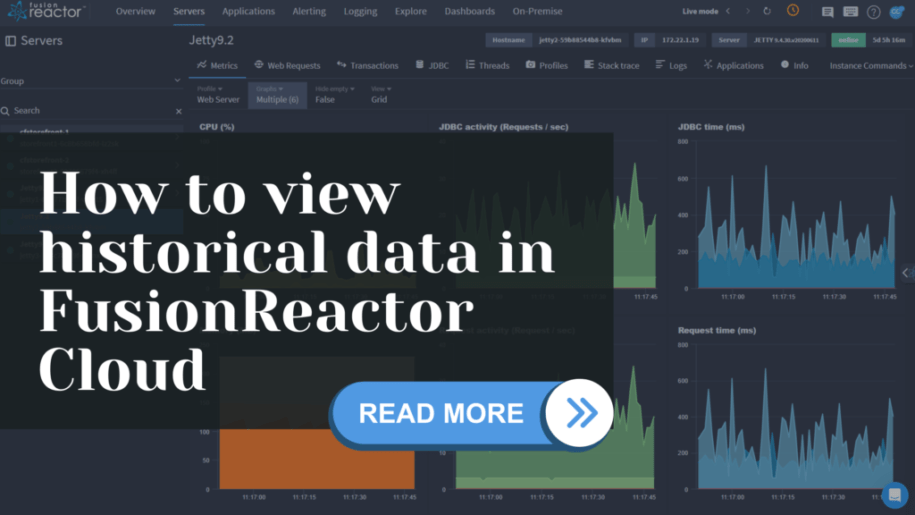
The Servers view overviews the servers running a FusionReactor agent within your infrastructure. You can see a broad overview of all servers or more detailed information about a specific subset. This view is unique as it supports both live and historical data modes.
Live mode, immediate, and historical data
Live mode:
The Servers screen operates in Live mode by default, indicated by an orange clock icon.
In Live mode, data is streamed in real-time from your instances, which is helpful for monitoring and resolving immediate issues.
Switching to historical data:
To view historical data, toggle the Live mode clock. Use the time picker to select the desired timeframe. You can filter historical data by default times (e.g., the last hour) or customize the time frame to meet your needs.
Applications view
The Applications list view provides an overview of all your applications running on servers with FusionReactor. Selecting an application will take you to the application details screen.
Application details
The Transaction List list displays all transactions associated with the selected application for the set timeframe.
Transactions can be filtered by:
Time Taken: This shows the percentage of time the application spends running each transaction.
Average Time: Displays the average time for each transaction, with a line indicating the average across all transactions.
Slowest: Lists the longest response time for each transaction.
Throughput: Indicates the number of requests for each transaction.
Errors: Shows the number of errors for each transaction that encountered issues.
Explore view
The Explore feature allows you to query and analyze all metrics, logs, and traces ingested into your cloud account. This feature is ideal for creating new data views and filtering data as needed.
Datasource selection
In the Explore view, you can select from three datasource options using the dropdown menu on the left of the screen:
Metrics: All metrics are sent from a FusionReactor agent, and additional metrics are created within the ingest engine.
Traces: Includes any slow or error transactions sent from a FusionReactor agent. Note that requests viewed in the recent or running tabs of the server view do not appear here as they are not ingested.
Logs: Contains logs sent to FusionReactor, either from a FusionReactor agent or log shipper.
Why analyze historical data?
Analyzing historical data in FusionReactor Cloud offers significant benefits for maintaining and optimizing application performance.
Key advantages include:
Visualizing data: Enables diagnosis of live and historical issues, providing insights into application performance over time.
Anomaly detection: Examining historical data facilitates setting optimal anomaly detection thresholds, helping distinguish true anomalies from normal fluctuations.
Viewing historical data: FusiopnReactor offers up to 13 months of metric data and 30 days of trace and log data storage, allowing for a review of past performance to diagnose issues that are not immediately apparent.
Live mode vs. historical data: This option allows users to toggle between live and historical data views for comprehensive analysis, facilitating both immediate issue resolution and long-term trend analysis.
Why use FusionReactor Cloud to view historical data
FusionReactor Cloud offers robust capabilities for viewing historical data, enabling you to monitor, analyze, and troubleshoot your applications effectively. By leveraging these features, you can ensure your applications’ smooth and efficient operation and quickly identify and resolve issues as they arise. Whether using the Servers, Applications, or Explore views, you can access detailed historical metrics, traces, and logs, providing comprehensive insights into your application’s performance over time.


