Log alerting
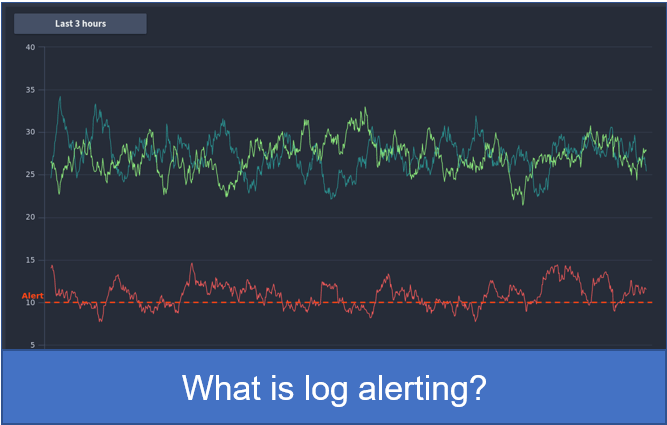
Log alerting allows you to set rules based on any log that is ingested either by an external log agent or the FusionReactor agent.
It is relatively simple to set up query-based alerts in LogQL. You can utilize your saved queries for events and dashboards to quickly generate high-value alerts.
FusionRactor gives you four kinds of alerts;
- Event-based alerts
- Rate-based alerts
- Value-based alerts
- Comparative alerts from log content
You control where alert notifications go
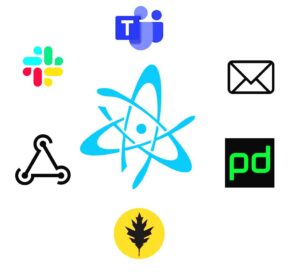
Alerts dispatch to the same subscriptions used in the metric alerting, so you can use any existing subscriptions or create new ones to use for alerts.
This allows you to dispatch alerts to:
- Slack
- Webhook
- OpsGenie
- Papertrail
You can use groups to organize and schedule rule checks, so for example a log-based alert might run a check every 15 minutes whilst an application alert could check far more frequently.
Event-based alerting
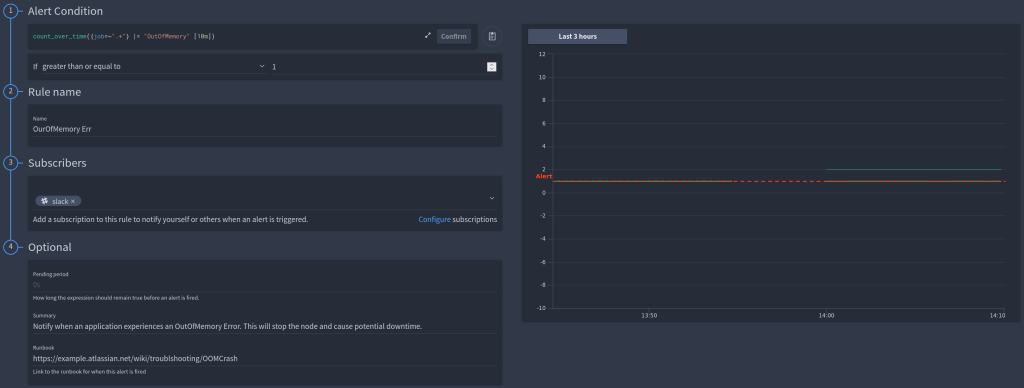
An event-based alert lets you know that something specific has happened within your logs. This is useful if a specific error occurs within your logs or a server crashes and shutdown logs are recorded. For example, in the video, we create an alert to notify us when our server crashes with an OutOfMemory exception.
The alert in the FusionReactor Cloud would look like this:
For the fully worked example, see our documentation
When this alert fires, we provide a runbook within the alert detailing exactly how to check that the system has fully recovered and ensured there was no impact on the users.
Rate based alerting
So rates are a function of LogQL, which effectively means instead of using the value of the numerical-functional field of a log, you can actually use the rate of change for that.
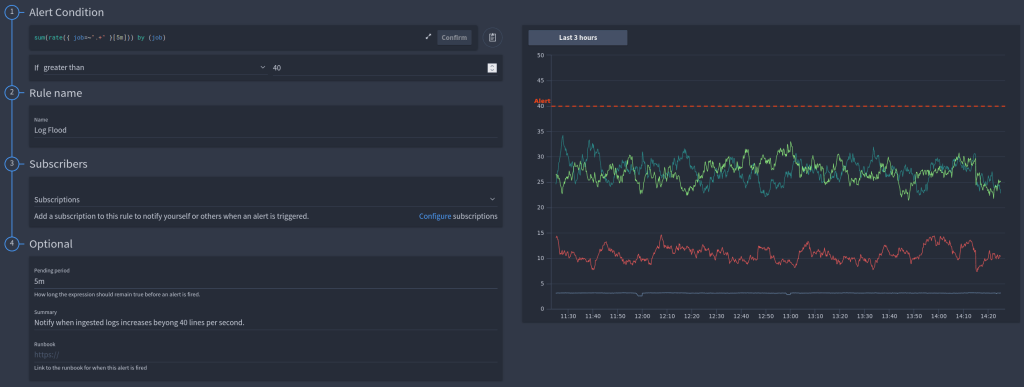
An example we recommend you all configure is to detect log floods.
We have a fully worked example of rate alerts in the video and also in the documentation. So for example you can set a threshold for log floods, once you reach the threshold an alert will fire.
Your rule and threshold are graphed in order for you to best develop your behavior plan in the FusionReactor Cloud UI. An important thing to note is that for this type of alert we would typically set a pending period in on our example.
A typical server restart expands the logs for around 30 seconds. Therefore this is normal and I do not need an alert for this. Using the pending period ensures that I only get alerts for genuine issues.
Value-based alerts
Alerts generated for log values can use either the count of logs matching a specific filter (Range based alerts) or fields contained within the logs themselves (Unwrap based alerts).
An example range based query counting the number of log lines containing the word exception:
sum by(job)(rate({job=~".+"} |= "exception" |= "exception" [5m]))
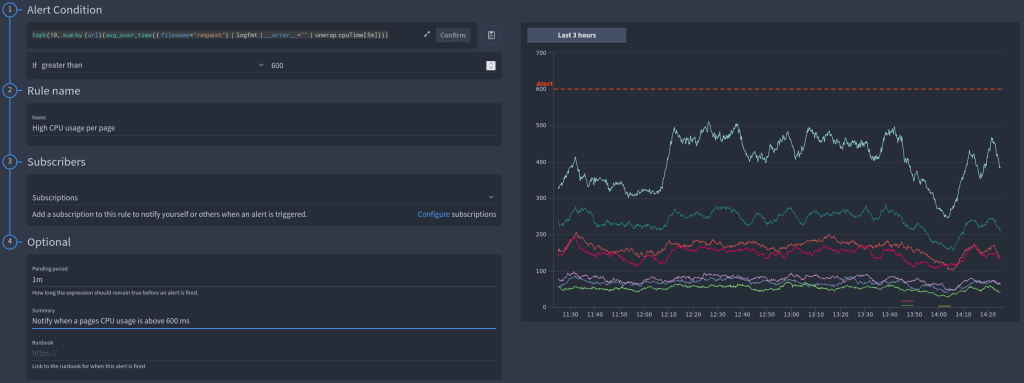
An example unwrap query calculating the average CPU time per application URL:
sum by (url) (avg_over_time({ filename="request"} | logfmt | __error__="" | unwrap cpuTime[5m]))
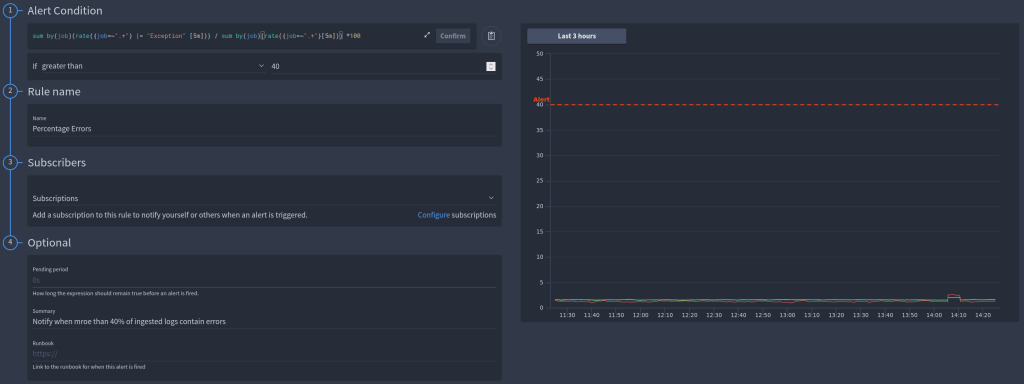
You can also chain multiple value-based queries together, for example here we are dividing the count of errors by the total logs ingested to calculate a percentage:
sum by(job)(rate({job=~".+"} |= "exception" |= "exception" [5m])) / sum by(job)(rate({job=~".+"}[5m])) *100
In the video, you will see 2 example alerts created, one to alert when the percentage of error logs ingested is too high as this indicates you have an issue occurring in real-time.
And another notifying you when the CPU time of a particular application URL exceeds a configured time.
These examples using the latest UI are also available in the documentation:
Range value-based alert (docs.fusionreactor.io/LogBeta/Log-Alerting/#range-value-based-alerts).
Unwrapped value-based alerts (docs.fusionreactor.io/LogBeta/Log-Alerting/#unwrapped-value-based-alerts).

