How to troubleshoot high CPU usage
In this scenario, our CPU is spinning at an abnormally high rate. We will then take a look at FusionReactor and see how it picks up this issue. For the test environment, we are using Microservices, SpringBoot, and Eclipse in conjunction with FusionReactor.
- Cloud-Native Platform: RedHat OpenShift Online
- Java version: OpenJDK
- Application development platform: Spring Boot
- IDE: Eclipse
- Monitoring tool: FusionReactor Ultimate Cloud
Java, Spring Boot and Red Hat OpenShift troubleshooting with FusionReactor
Video by Pierre-Hugues Charbonneau
The scenario
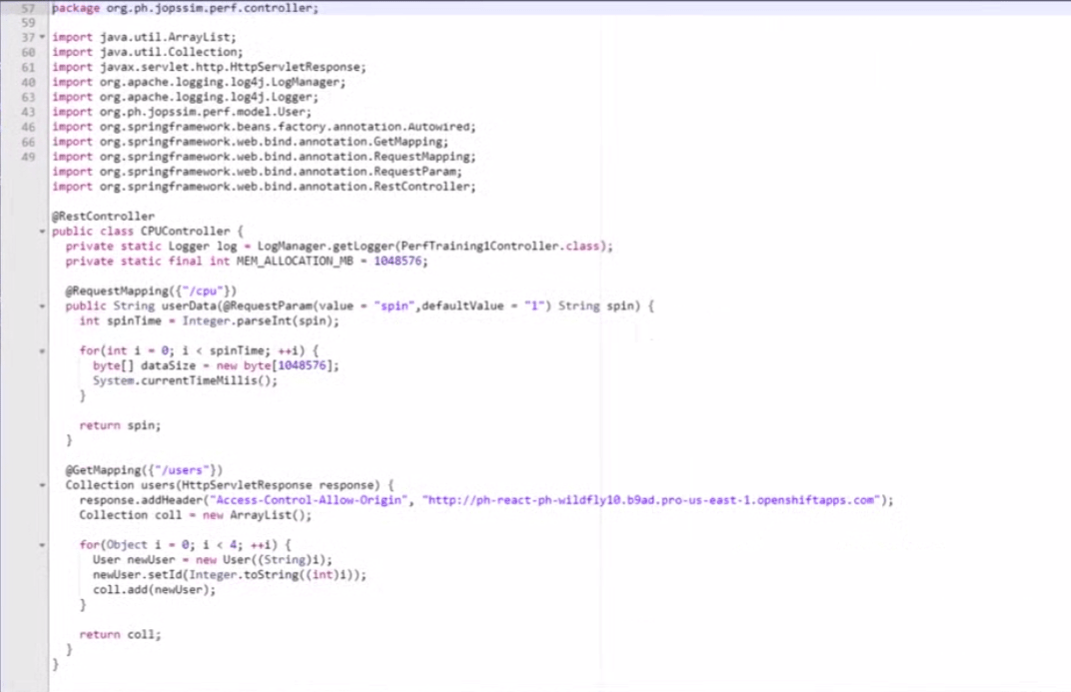
For this example, a 50,000 spin was created on a single request with one megabyte of memory on an empty buffer.
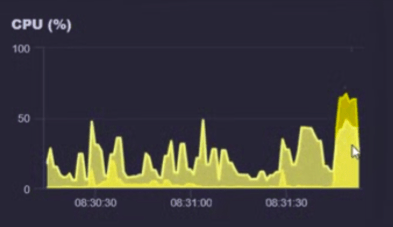
How to Troubleshoot high CPU usage
FusionReactor immediately detects that the CPU is rising
Troubleshoot the CPU impact on the garbage collector
We can see that the request did create some garbage collection, we can see that the GC did its job and memory was freed up with no liquid.
The memory heap quickly returned to normal and there is no evidence of a memory leak.
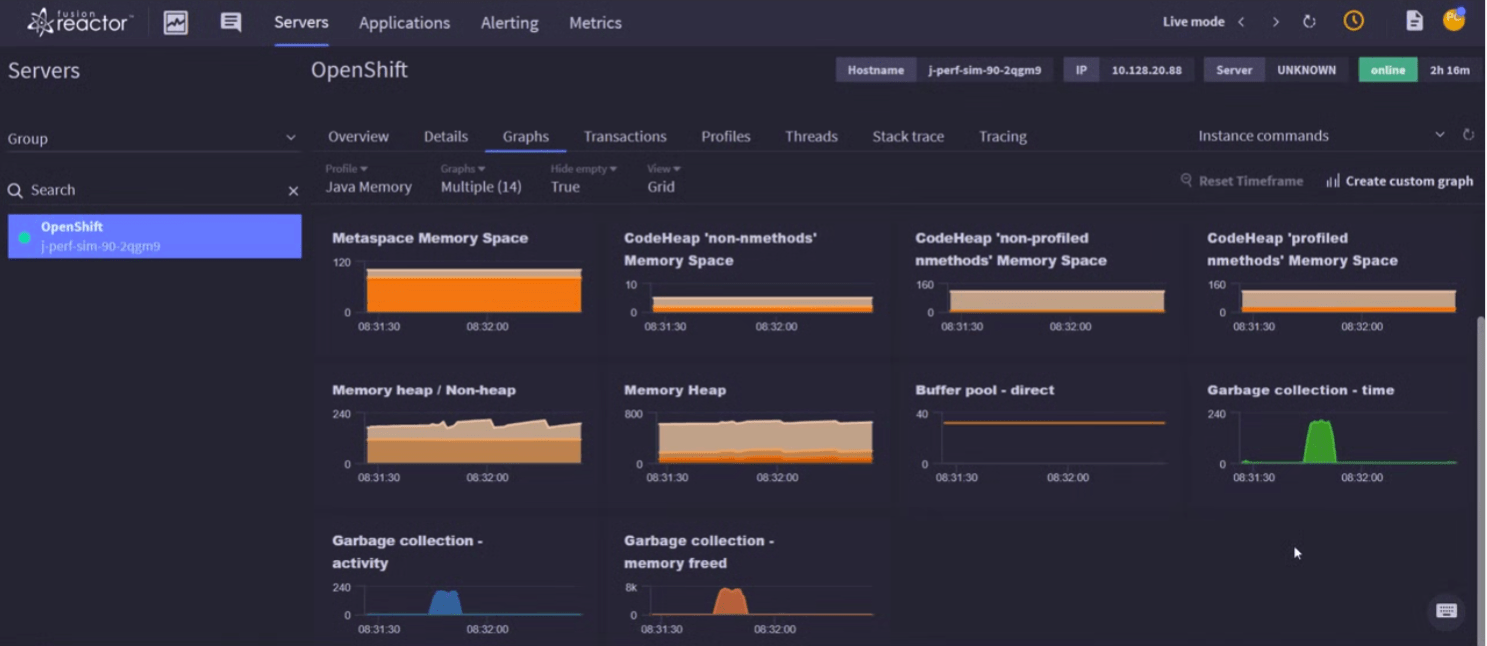
Why did the request impact the GC?
To determine why the request has such a profound effect on the GC we need to drill down a little deeper. Next, we will take a look at the transaction.
FusionReactor Transaction view will allow you to see your top requests, not surprisingly our test request which created the 50,000 CPU spin is at the top of the list
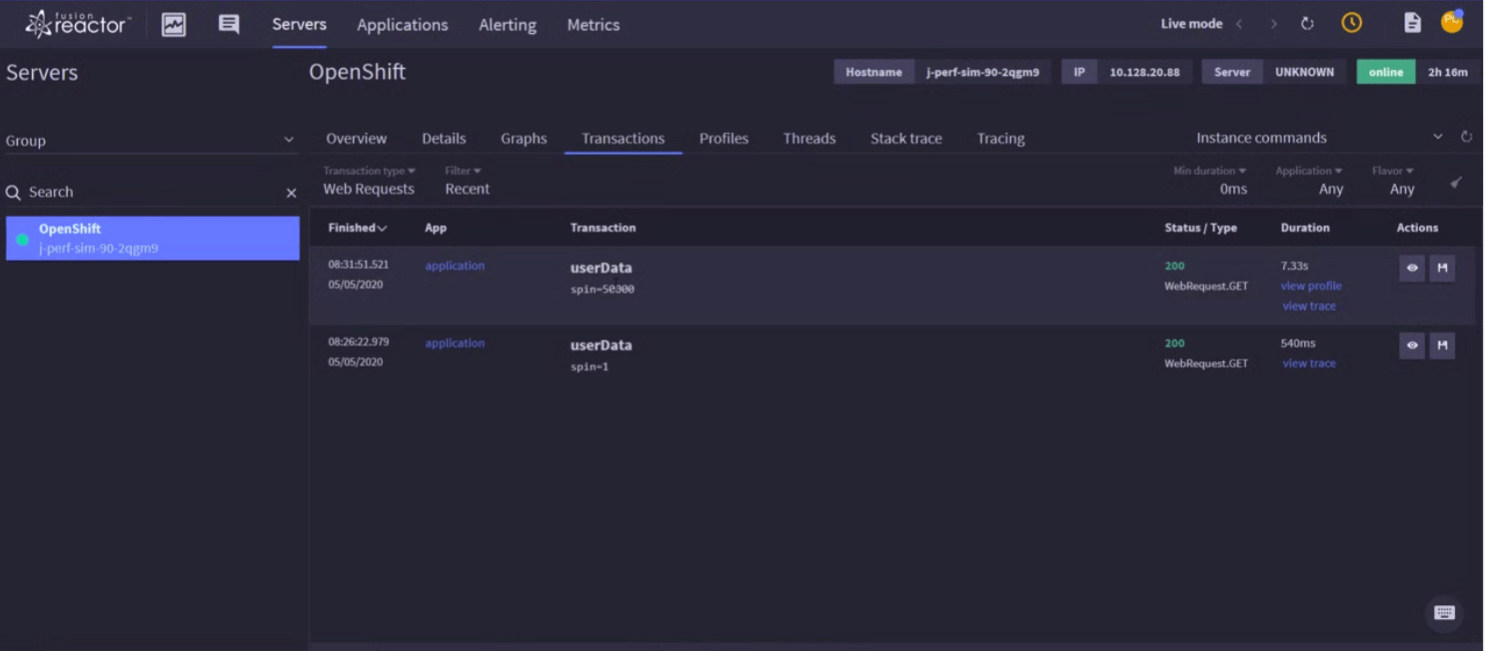
FusionReator will detect excessive allocated memory
The General tab gives us the base detail of the request which includes the status and the time it took to run. Scroll down and you will see the detail of the stream and the memory. You may recall GC activity which led us to investigate memory and when we take a look at Transaction Allocated Memory this is 52 megabytes. This matches exactly what we expected when we programmatically made the CPU spin at 50,000 with one megabyte of memory on an empty buffer.
Take a look at the profile and you will see a code-level view of where the time was spent, FusionReactor will even let you decompile that code on the fly!
What is the process for troubleshooting CPU issues?
- Go back in time and look at the heavy CPU calls
- Look at the allocation of memory
- look at the code
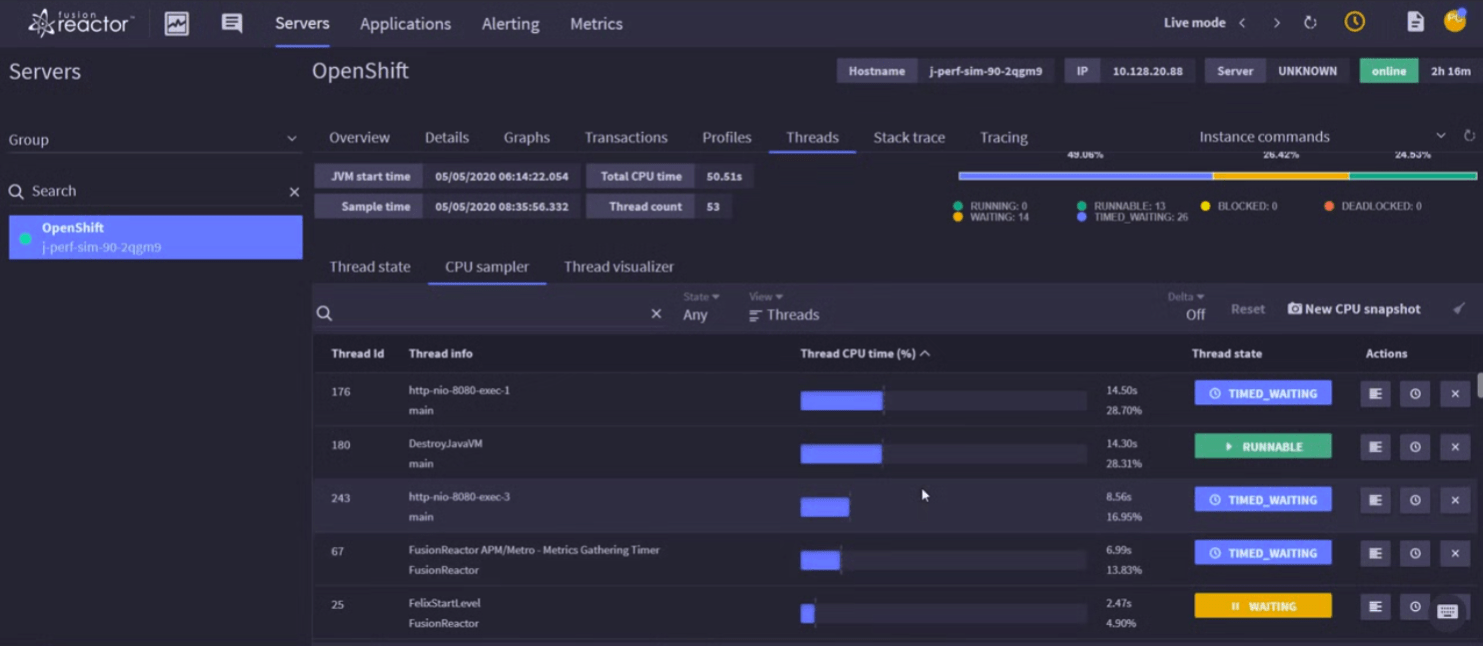
Troubleshoot CPU issues with a profiler
The CPU profiler is a CPU sampler that will give you a detailed breakdown of the thread giving breakdown by percentage and number of seconds for each thread. This is similar to JStack for example. The advantage of FusionReactor is that you can also monitor from here as well making FusionReactor a singular solution for chronic CPU issues.
How to Troubleshoot high CPU usage
FusionReactor gives you the tools to drill down to code and thread-level when investigating CPU issues.
Spot issues as they happen using the monitor:
- Look at the allocation of memory
- Look at the code
- Decompile the code
- Run the thread profiler for a breakdown of threads


