How to use Log Dashboards to gain actionable insight
Logs have many valuable functions; they contain a considerable amount of data. Using log query languages such as LogQL allows you to get fantastic insights, but they rely on running queries manually. Log dashboards give you the capability of storing and automating your queries. For example, the FusionReactor dev team uses a series of dashboards to monitor Cloud deployment. This dashboard enables us to see if everything’s healthy and running smoothly at a glance.
Dashboards are straightforward to monitor as they give you a more holistic view. They enable us to pick up problems and fix them before we get reports from customers that we have an issue.
Dashboards give you three core benefits
- Improved stability
- Improve performance
- Vastly reduced downtime
Dashboards that I use daily
Log rates that show me log ingestion tell me exactly where my logs are coming from and show me any spikes or errors that may be causing issues, such as log floods
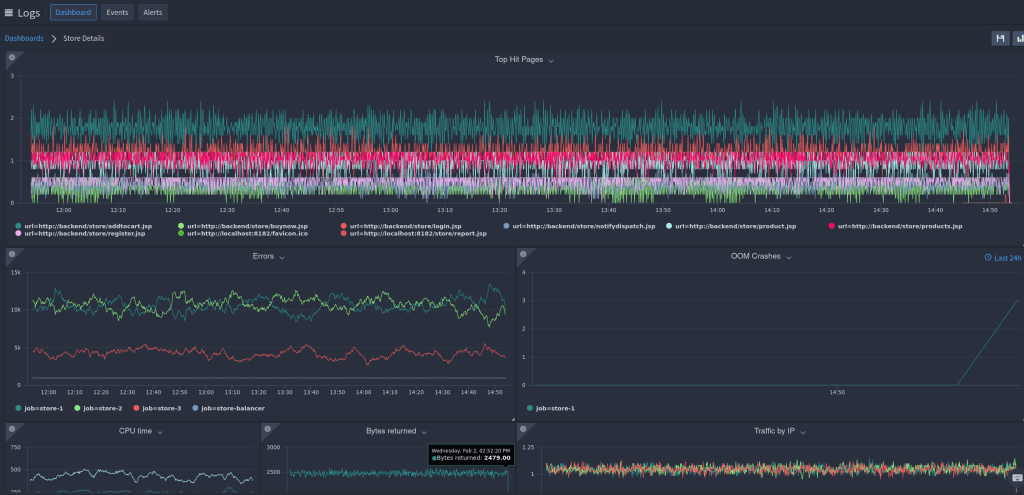
I have a balancer dashboard, which examines my load balancer’s performance. The dashboard tells me the traffic volume by IP, which lets me see if my server is under attack and helps me understand where my load peaks during the day. My dashboard also gives me a breakdown by status code to spot any errors quickly.
A store dashboard monitors my app performance, throughput, response times, and error rates.
Why do I need a log dashboard?
You can use dashboards to visualize your logs and spot patterns in your logs. In the video, I take you through the metrics in each dashboard and explain how I use the dashboard daily. Each graph presented in the dashboard allows me to deep down into the individual logs’ data and the logs surrounding the issue to give me a better understanding.
Dashboards save you a load of time because they stop the need for hunting in your logs to find problems, as you can see them at a higher level. Using your log dashboard with Log Alerting gives you a powerful tool that actively tells you whenever you have a problem.


