FusionReactor 8.8.0 has been released with the following enhancements:
- We now will send CF metrics up to the cloud
- Display additional DB request details, such as row count and DB, and API summary information
- The graph rendering is now capable of smoothing and averaging data `
- We have also increased the security of user passwords, using the PBKDF-2 algorithm.
For more information, please see our release notes.
Big thanks to CF veteran, consultant, and friend of FusionReactor Charlie Arehart, who has documented the new FusionReactor release in more detail. He has permitted us to include portions of his post content below.
His post expands on the brief bullet points in our release notes with screenshots and more context. Charlie didn’t have advanced notice of our release; therefore, his content reflects his assessment of things, having recently applied the update.
How to get the latest version of FusionReactor
There will be a notification at the top of your FR pages if you are using a recent release (8.1 or above), telling you there’s a new update, and offering a link to download it. OR you can go to the download page.
It’s up to you whether to use the “automated installer” (if you’ve been using the FusionReactor AM Service and the FRAM UI, both of which use port 8087) or just the fusionreactor.jar (especially in the case of manual/scripted/minimalist installations).
For more, see the available docs (for automated and manual installation) and the installation videos. Charlie also has a 2018 post on the topic of updating FR.
What follows are the headings for each bullet point in the release notes for FR 8.8.0, presented in the same order they were offered there, with Charlie’s elaboration on each.
Warning: “Upon upgrade, only FusionReactor 8.8.0 dashboards can monitor 8.8.0 instances”
As for this first bullet point in the release notes, you should note that the heads-up only applies to those using the FR Enterprise Dashboard feature, which is a) only available in FR Enterprise or Ultimate, and b) optional.
If you have set it up, you can see the warnings and additional bullets relating to this latest update. It is important to note that the Enterprise Dashboard (ED) is an on-premises feature of FR, and has nothing to do with the FR Cloud.
The ED does exist and can be setup in ANY FR instance or even in a FRAM instance (perhaps even on a different machine than where you have your FR instances monitoring CF, Lucee, or other Java applications). There is a small “globe” icon at the top left of the on-prem FR UI (for Enterprise and Ultimate). If you do not use the ED, then this first issue does not apply.
New Feature: “CF metrics are now sent to the cloud.”
This may be (currently) the least interesting “new feature” (indeed, all the others are shown on the release note to be “improvements” technically). You will see no change in the FR Cloud UI yet. The change is in preparation for a coming new set of “dashboards” in the FR Cloud UI, not yet implemented with this change.
What is FR Cloud?
FusionReactor Cloud (sometimes called SaaS) is an EXTENSION of your current on-premises implementation of FR (available to those using FR Enterprise or Ultimate). For more on that, including migrating to it, see this page on the FR site, where it’s also referred to as FR SaaS. It also includes a 10-min youtube video providing an overview of FR Cloud.
Improvement: “Send specified request or response headers to the cloud.”
This is an expansion of a new feature added in 8.7.5 With THAT feature (added in 8.7.5), you could now nominate any header (request or response) that you wanted to appear on the front page list of requests (such as requests>activity or requests>history).
As for what’s new, like the feature above, this is more about the info now ALSO being sent to the cloud, in anticipation of a new feature to show them there. For now, they don’t show up in any special way in the cloud.
But for those who didn’t notice this feature as added in 8.7.5, let me show you:
About the related feature as added in 8.7.5
Consider for example if you may wish to focus on the “user-agent” of all incoming requests. Of course, you could always drill into each request’s details page and choose its “headers” tab (in both the on-prem and cloud UIs).
But with this new feature as of 8.7.5, you could configure FR to show that and any other desired header(s) on all the FR request list pages, where it/they would show up under the URL and query string. Same with if you wanted to log the “location” response header for a 302 or 301 redirect.
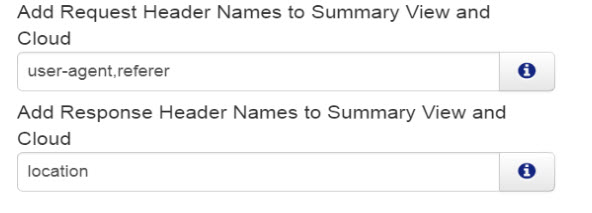
In the screenshot below, I have configured both “user-agent” and “referer” request headers as well as the “location” response header. Notice how each appears if configured. And, of course, a request that is not a 302 or 301 redirect won’t have such a “location” response header, just like the one that’s not linked to another web page won’t have a “referer”:

As for how to set this up, note that it’s done on the Request>settings page. As of FR 8.7.5 or above, there is now this new pair of fields at the bottom of that page (the word “and Cloud”) is new in 8.8.0. Here you can see how I configured those headers to be shown above:

NOTE first that you can indicate multiple values separating them with commas (or semi-colons, as indicated by clicking the “i” icon to the right of the field).
Note also ESPECIALLY that these are case-sensitive. They must match whatever is shown in the FR “headers” tab for a request having such headers. So notice that I have it as “user-agent”, not “user agent” nor even “User-agent” (and “location” not Location), even though in your browser Dev tools, you may well see these listed as User-agent and Location. If you don’t provide the correct case, the headers will simply not appear on the request list pages.
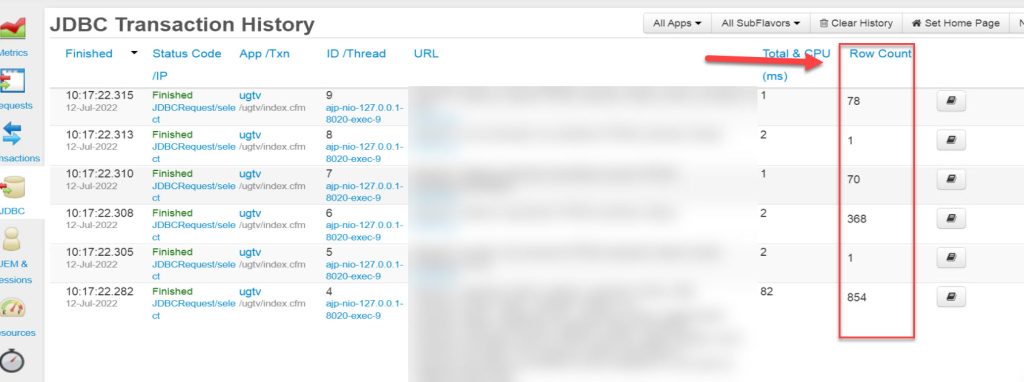
Improvement: “Row Count is now displayed in JDBC history lists.”
This is another one of those “little things” that may delight some. FR has shown the row count for many years on the request details page and its JDBC tab.
This new feature is instead about the info now being shown on the pages that list JDBC transactions ACROSS requests, such as JDBC>JDBC History, or >JDBC Error History or >Longest Transactions, etc. All these now show a row count. Consider the screenshot below:
A couple of notes on this: I notice the rowcount col also shown on the jdbc>activity page, which would be about running queries. But I’ve not yet caught a query running long to see if it somehow is tracking the rowcount as the query proceeds (which is possible, at least in terms of how many rows have yet been sent over the JDBC driver). It may be that this is an oversight, and it’s NOT meant to be shown on that page.
Finally, a slight niggle is that the row count column is NOT yet shown if the JDBC requests are viewed using the Transactions pages, as in Transactions>History pages, even when “JDBC” is selected as the transaction type at top of such a page. Again, that may be an oversight or may be intentional.
Improvement: “Implemented the ability to view graphs as smoothed/averaged.”
This is another “hidden gem” type feature that may delight some. If you’ve used the various FR graph pages, you may have wished that you could see them depict not just the actual values (the values graphed) but instead an AVERAGE of them, over the selected time.
That is now possible using a new “Display Average” button. This is offered on pages like Requests>Time Graph or Resources>Memory Heap or Resources>CPU Graph. (And while those can be linked to from Metrics>Web Metrics graphs via a hyperlink under each of its graphs, this average feature is NOT yet offered on the Web Metrics graphs themselves.)
Again, if you click the new “Display Average” button, this will toggle on/off, showing the AVERAGE of values vs the actual data points. The difference in what’s shown in many graphs may not be that significant. This average may be more valuable when the graphed values vary sharply over time. (I have long wished they’d instead show a single line on the graphs representing the average, but this is better than no average at all). Here is a screenshot showing the Resources>Memory Heap page, and the new button:
Improvement: “Increased the security of user passwords, using a PBKDF-2 algorithm.”
This feature is, of course, primarily a security feature, which might generally have no effect on one’s day-to-day use of FR. But recall the first point above about the inability of the ED to work with older FR versions. I suspect this change is related to that impact.
Improvement: “DB and API time columns added to the table view of request log in the archive viewer”
To be clear, the DB and API time columns are themselves not “new”, in that they were added to the UI first as of FR 8.7.4. And as of 8.7.7, this data had ALSO been added to the FR request logs, See Charlies Blog.
But while 8.7.7 had added those as the last columns of the FR request log, a problem was that the FR Archive Viewer had not been updated in 8.7.7 to SHOW those new columns. (The Archived Metrics page, which was added a few years ago in FR 8.7.2, allows VIEWING of all FR logs as graphs or text. It can be accessed a few ways in the FR On-prem UI, such as Metrics>Archived Metrics, )
Now, as of 8.8.0, those two new columns ARE displayed. Here’s a screenshot:
For those who use the Archived Metrics feature and might look at the request log display, it’s a helpful addition.
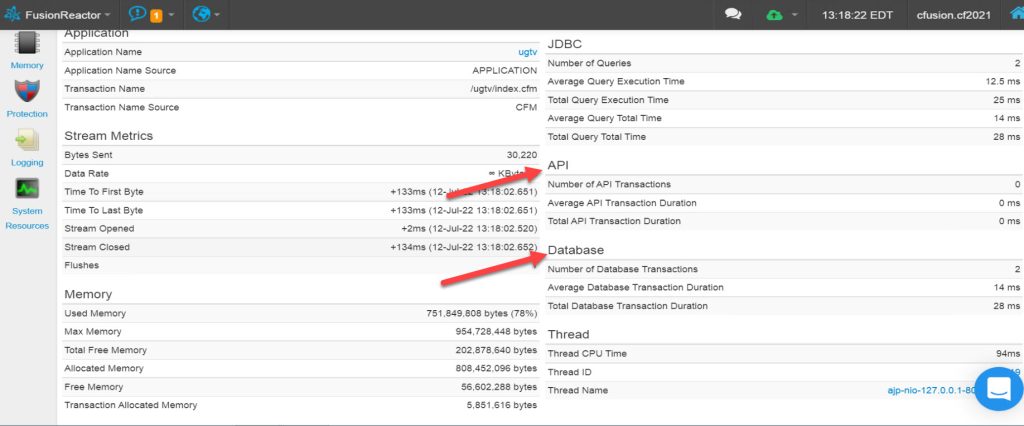
Improvement: “DB and API time summary now included on the main tab of a transaction.”
Finally, this last setting ALSO expands on some previous work. We’ve mentioned above how FR 8.7.4 had added a new display of DB and API time columns in various request list pages of FR. See Charlie’s post.
What’s new in 8.8.0 is that this info is now repeated in the DETAILS pages of a new request, on the “main” tab, via new sections shown in the bottom right, below the current JDBC, thread, and CPU sections. Here is a screenshot:
Again, for those who may tend to dig into that request details page and want to be able to see this break-out, especially the API time (since the JDBC time was indeed already there), this is a nice addition.
Thanks once again to Charlie Arehart, who is a long-term fan of FusionReactor and has created a load of resources over the years including:
- Several hour-long webinars are available as a playlist on his YouTube channel.
- Over 50 FR blog posts here,
- Charlie has also written articles on this blog, such as Changing FusionReactor’s “Slow Request Threshold”, Why and How.


