We are very proud to announce the release of FusionReactor 9.0, which represents a major milestone for FusionReactor and has been almost 2 years in the making.
FusionReactor has always been about helping engineers, support, and DevOps to get to the root of application problems as quickly as possible. As software engineers, the founders of the company wanted to develop a product that would be familiar to us, and which would enable us to resolve performance and stability problems quickly. Up till now, we have focused the product on serving the ColdFusion and Java applications market. Our commitment to these platforms will not change.
Some of the elements which differentiated FusionReactor from other monitoring tools have been the inclusion of developer-focused features, such as our pioneering production debugger and continuous profiling tools. These capabilities make so much difference when it comes to focusing on what’s really important in production environments and how applications are being affected.
Our aim is to provide a ‘Unified Observability’ platform, which is rich and scalable, allowing developers to troubleshoot issues quickly and effectively across modern architectures
We are committed to continuing our focus on “the details” and ensuring that our customers are armed with the right information and insight to pinpoint issues as quickly as possible.
In recent years though, the “trend” within monitoring (observability) has moved. We’re witnessing a major shift towards providing capabilities to support multiple languages, capturing metrics & traces as well as ingesting and monitoring the enormous and ever growing amount of application and system logs. This is being combined with the need to support the capture of telemetry from multiple different technologies used within your infrastructure and cloud service architectures. The future will be to combine all of this data and provide AIOps using Machine Learning (ML) techniques to give root cause answers and automated solutions before you’re even aware that anything is even going wrong. We anticipate the next wave will be predictive monitoring and will be based on broad data analysis and observability combined with ML.
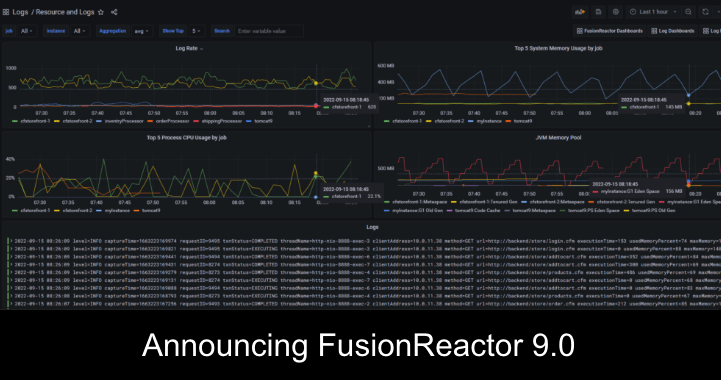
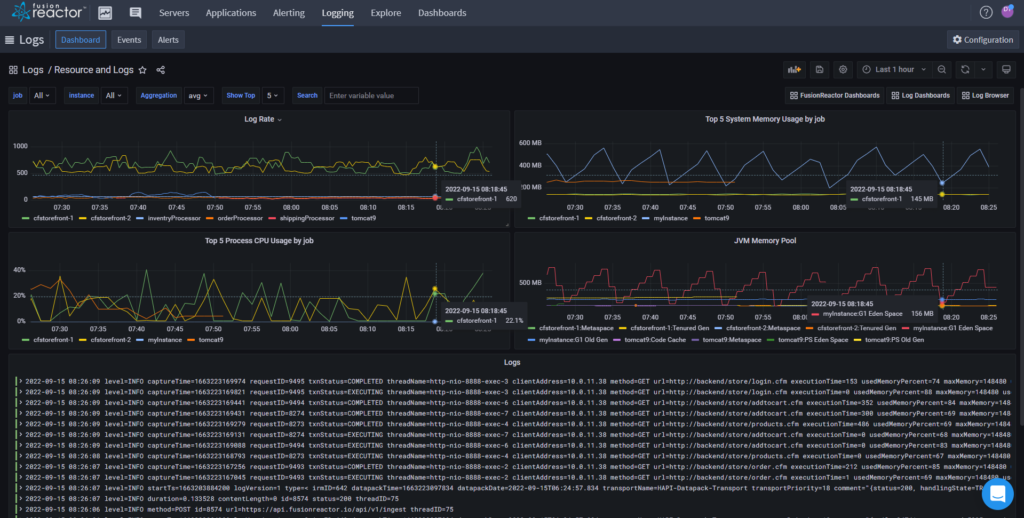
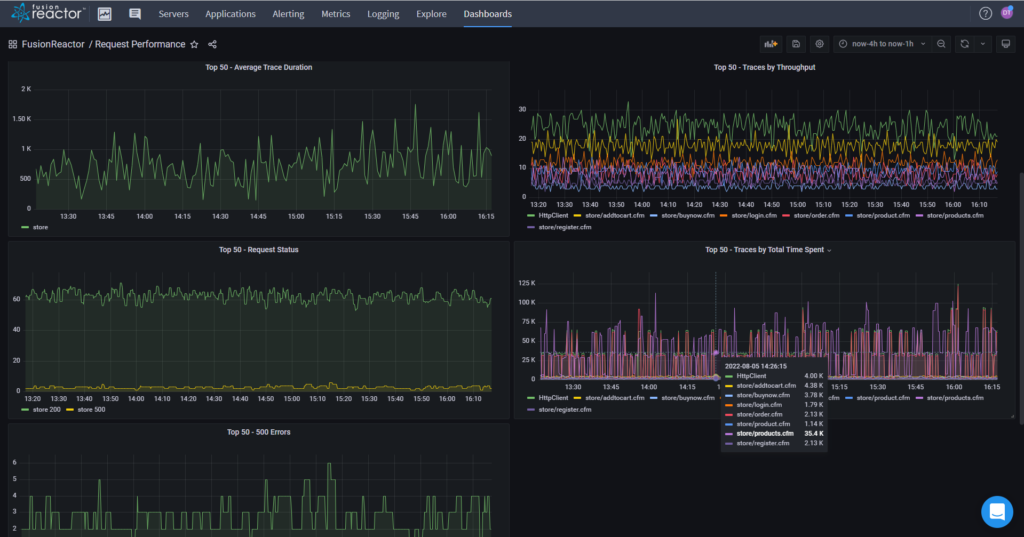
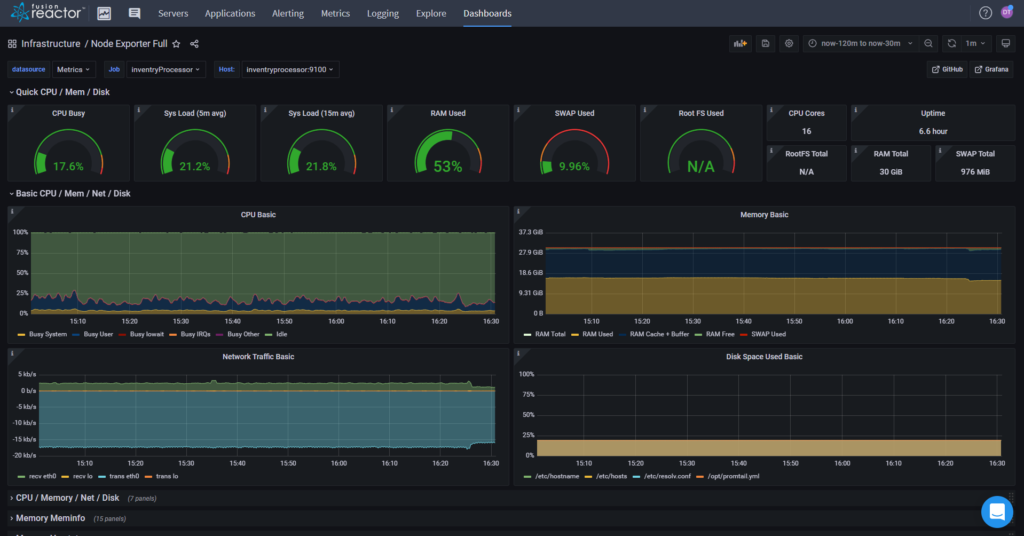
To support these capabilities and the shift in monitoring requirements, we have dedicated the core of this release to re-building and re-architecting our complete monitoring infrastructure. Using the advice and technical direction provided by Gartner, Inc we now have a powerful, modern, and scalable architecture that is perfectly positioned to take advantage of new open-source technologies, such as Loki, Cortex/Prometheus, and Tempo, as well as supporting a broader range of monitoring agents using the OpenTelemetry standard. To complement these data handling components we have integrated a new, rich visualization layer using Grafana. Because Grafana seamlessly integrates Loki, Cortex/Prometheus, and Tempo, it allows us to create a multi-tenant, unified observability platform dashboard solution for visualizing Logs, Metrics, and Traces in one place. For FusionReactor 9, much of the new functional capability is focused on log monitoring, and we can now ingest, monitor, and index any logs (not just from FusionReactor!). FusionReactor uses Loki, which is an open-source project for log aggregation developed by Grafana Labs. Loki indexes the metadata e.g. server and application names, and the actual log content is stored as chunks in object stores. We have created several custom dashboards to present the log data in ways that we believe will accelerate the task of pinpointing errors. One such dashboard shows the correlation between resource consumption and logs.
We hope that you enjoy and can benefit from the exciting developments we have in FusionReactor Cloud. This new platform will transform how we’re able to deliver feature-rich capabilities in the shortest possible time.
David Tattersall – CEO Intergral – makers of FusionReactor


