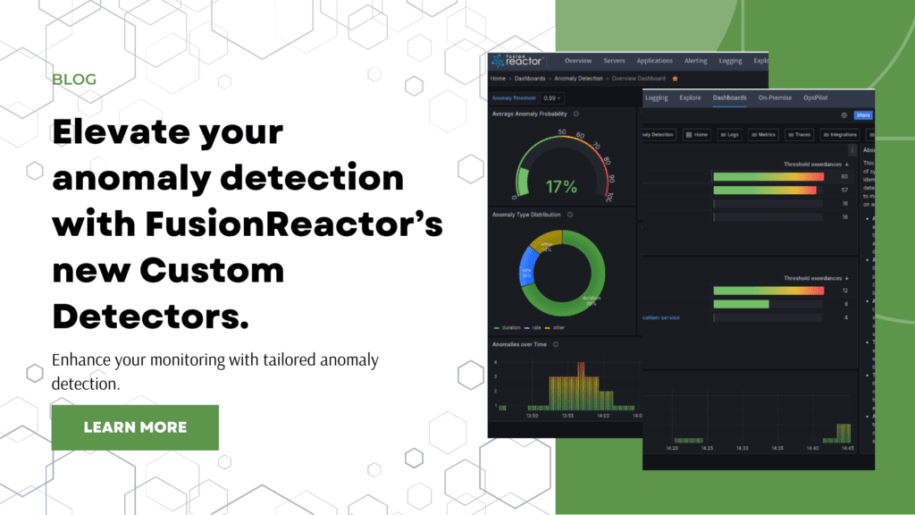
Enhanced anomaly detection
FusionReactor Cloud has been upgraded with new Custom Detectors, enhancing its anomaly detection capabilities. This feature allows for more precise monitoring and diagnostics of your application’s performance. Setting up Custom Detectors requires manual input and some knowledge of PromQL, but they offer exceptional customization, letting you set specific conditions or thresholds that match your application’s particular requirements.
Benefits of using Custom Detectors
Enhanced customization: Custom Detectors allow you to set specific conditions or thresholds that match your application’s requirements. This level of customization enables more precise monitoring tailored to your unique environment.
Flexibility across technologies: While there are pre-configured detectors for Java and ColdFusion, you can create custom detectors for any technology stack. This allows you to monitor CPU, memory, or any other crucial resources relevant to your application, regardless of the underlying technology.
Precise anomaly detection: The ability to define exact metrics and conditions relevant to your application allows for more accurate identification of performance bottlenecks and potential issue
Pre-configured detectors for Java and ColdFusion
FusionReactor Cloud offers three pre-configured detectors specifically designed for Java and ColdFusion environments to jumpstart your custom anomaly detection. While these may not apply directly to other technology stacks, they are excellent templates for creating custom detectors.
Monitor what matters
With FusionReactor, you can create custom detectors for monitoring CPU, memory, or any other crucial resources relevant to your application. This flexibility accurately identifies performance bottlenecks and potential issues across various technologies, helping maintain your application’s efficiency and reliability.
Steps to add a Custom Detector
- Navigate to FR > Alerting > Anomaly Detection (Beta) > Custom Detector
- Select the ADD DETECTOR button and configure the Custom Detector settings as follows:
- Enter a unique query label.
- Set the aggregate.
- Enter a PromQL expression.
- Adjust the anomaly probability threshold according to your needs.
- Select the Time Range and Pending For intervals.
- Select from predefined subscriptions to determine where alerts for anomalies should be sent.
- Click the APPLY CHANGES button.
- Toggle the Anomaly Detection check to enable the Custom Detector.
How are Custom Detectors different from the RED method of anomaly detection?
Custom Detectors and Service Detectors (RED) serve different purposes in anomaly detection, each suited for specific monitoring needs. Custom detectors offer high flexibility, allowing you to create tailored conditions or thresholds for your application’s unique requirements. These can incorporate complex logic to target particular anomalies of concern. In contrast, Service Detectors focus on preconfigured anomaly detection for a given service’s Rate, Errors, and Duration metrics.
While custom detectors excel at identifying specific, non-standard issues, Service Detectors provide efficient, out-of-the-box monitoring for these key service health indicators. Custom detectors offer precision and customization, whereas Service Detectors provide simplicity and quick setup.
It’s important to note that Custom Detectors and Service Detectors typically require some level of user adjustment or tuning to achieve optimal results. Users should expect to refine detector configurations based on their application behavior and performance patterns. This fine-tuning process helps ensure the detectors accurately identify relevant anomalies while minimizing false positives.
Both approaches have their merits, depending on the monitoring scenario and specific needs of your application. The choice between them often involves balancing the desire for customization with the need for quick implementation and ease of use.
Enhanced anomaly detection with Custom Detectors
FusionReactor’s new Custom Detectors feature significantly advances application performance monitoring. By offering granular control over anomaly detection, teams can create highly targeted monitoring solutions to identify issues before they impact users.
Whether you’re running Java, ColdFusion, or any other technology stack, Custom Detectors provide the flexibility to monitor CPU, memory, or any other crucial resources relevant to your specific application. This level of customization ensures that you can maintain your application’s efficiency and reliability with unprecedented precision.
As you implement Custom Detectors, remember that the key to success lies in understanding your application’s normal behavior and fine-tuning your detectors accordingly. You can create a robust anomaly detection system with practice and iteration that keeps your application running at peak performance.


