Deep dive into log monitoring
In a digital landscape where data drives decision-making, log monitoring and management have become indispensable. FusionReactor, an observability platform, is at the forefront of offering robust log monitoring solutions. This blog post will serve as a comprehensive guide to logging in FusionReactor, covering everything from getting started to setting up alerts based on your logs.
Getting started
Starting with FusionReactor couldn’t be simpler as logs will be automatically ingested into your FusionReactor Cloud account. Once you’ve done that, the FusionReactor agent will kick in, sending application and error logs out of the box. If you’re still using an on-premise license, don’t worry; transitioning to the Cloud is just a click away.
How to visualize your logs
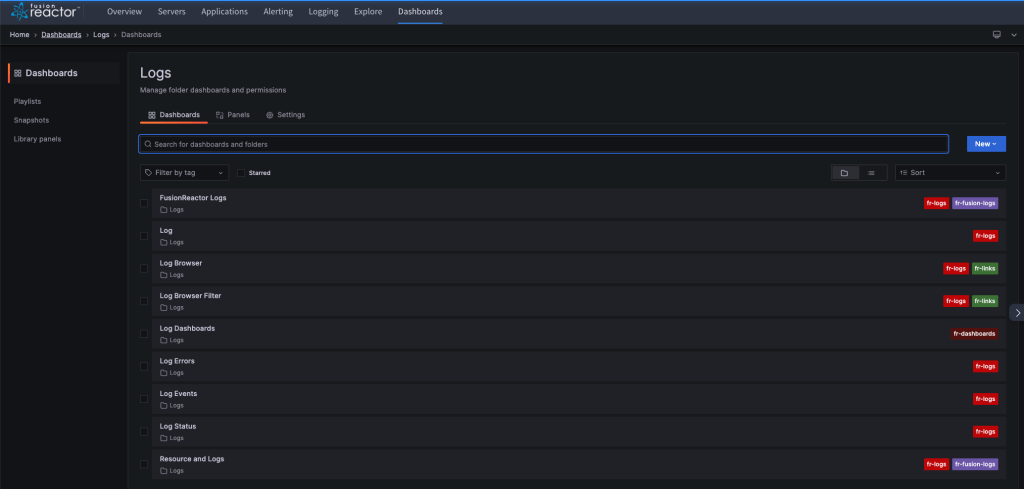
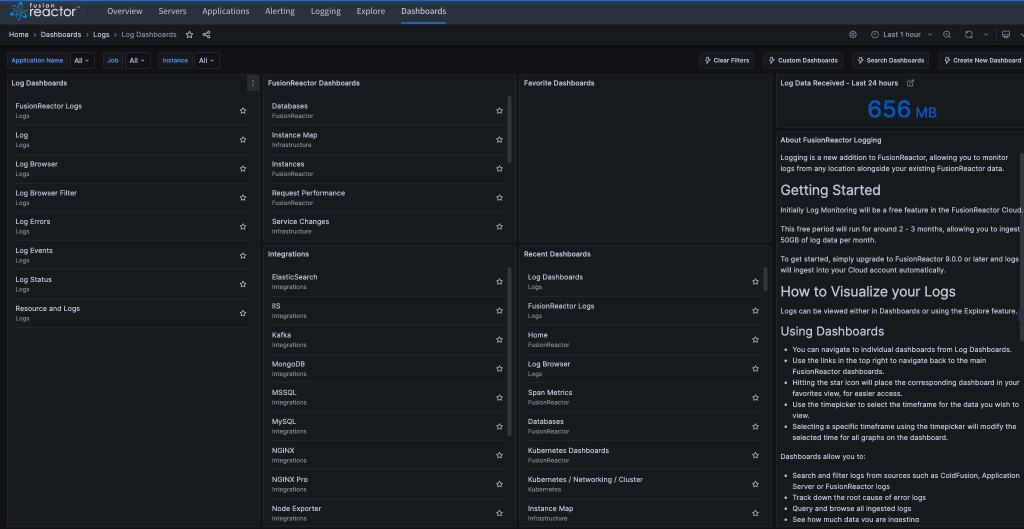
Preconfigured dashboards
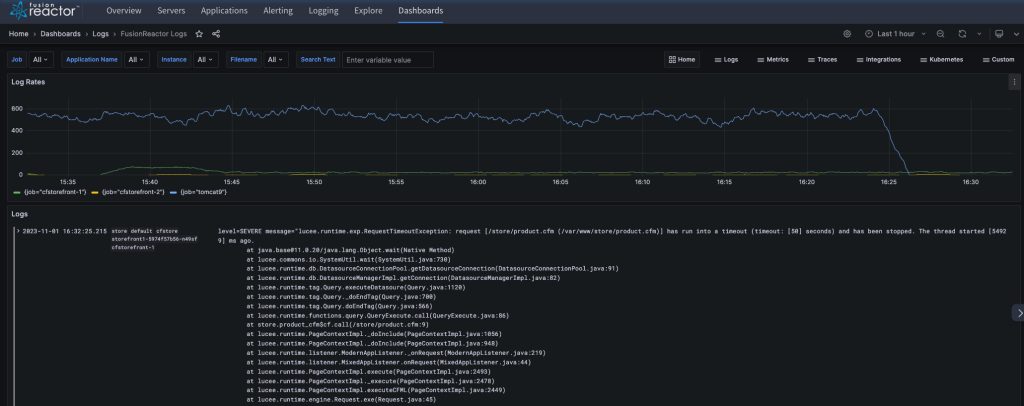
Once your logs are ingested, FusionReactor provides an array of preconfigured dashboards designed for powerful analytics. With these dashboards, you can:
- Search and filter logs from various sources, such as Application Server or FusionReactor logs.
- Trace the root cause of error logs.
- Query and browse all ingested logs.
- Monitor your data ingestion rate.
- Identify memory and CPU bottlenecks through logs.
Exploring your logs
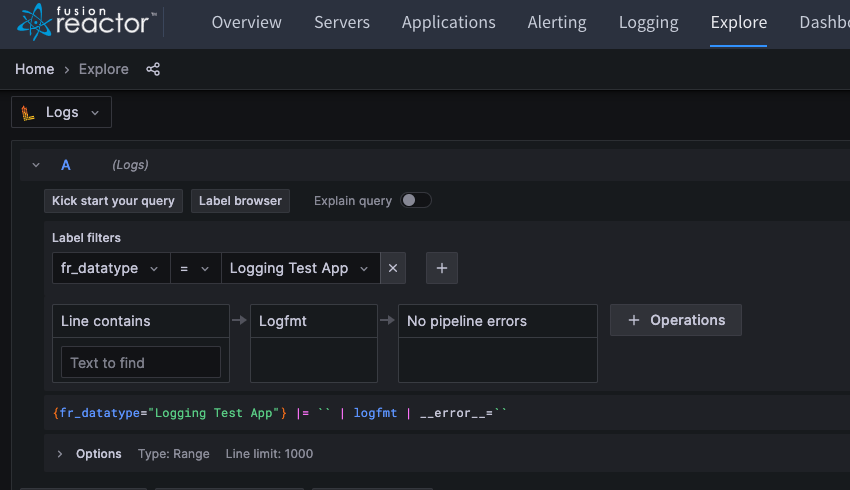
For users looking for a more in-depth analysis, FusionReactor offers the Explore feature. Here, you can employ LogQL queries to sift through your data and get to the insights that matter the most to you.
Sending additional logs to FusionReactor Cloud
Using agents
Additional logs can be forwarded to FusionReactor Cloud via the FusionReactor Observability Agent.
FusionReactor-specific logs
If you wish to send FusionReactor logs, this may require a bit of additional configuration, as the metrics and transactions from FusionReactor are already available in other views and dashboards.
Logs sent through the agent also have configurable options, such as:
- Obfuscation to remove sensitive content
- Roll-up features to make the logs more readable
Using dedicated logging agents
To ingest logs from other sources such as nginx, IIS, or databases, you can configure a logging agent using an API key from your FusionReactor Cloud account.
Alerting on log behavior
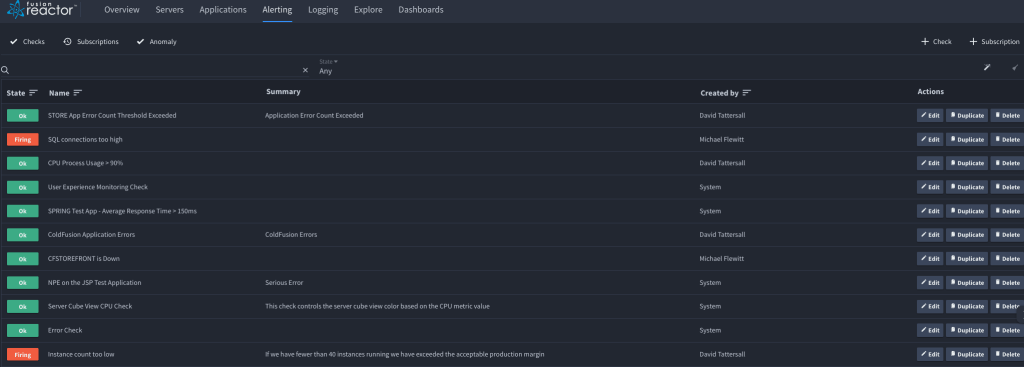
FusionReactor also allows for log-based alerting, enabling you to create rules based on log metrics or behaviors. This is particularly useful for identifying issues like log floods, log error spikes, and abnormal log activities. These alerts can be dispatched to the same subscriptions you’ve used for other types of alerting.
Setting this up is straightforward. Please follow these instructions from the docs.
Conclusion – deep dive into log monitoring
FusionReactor provides an exhaustive set of features that make log monitoring and management a breeze. From powerful preconfigured dashboards to robust alerting mechanisms, FusionReactor equips you with the tools to ensure your systems are efficient, secure, and continuously optimized.

