In today’s fast-paced tech world, performance optimization is not just a luxury; it’s a necessity. To optimize your Java and CF environments means having a robust set of tools that can effortlessly profile requests and transactions, ensuring your applications run smoothly and efficiently. FusionReactor is at the forefront of this, offering a suite of advanced tools, including a Profiler, Event Snapshot, and database monitor, specifically designed to supercharge your production environment.
Effortless profiling with minimal overhead
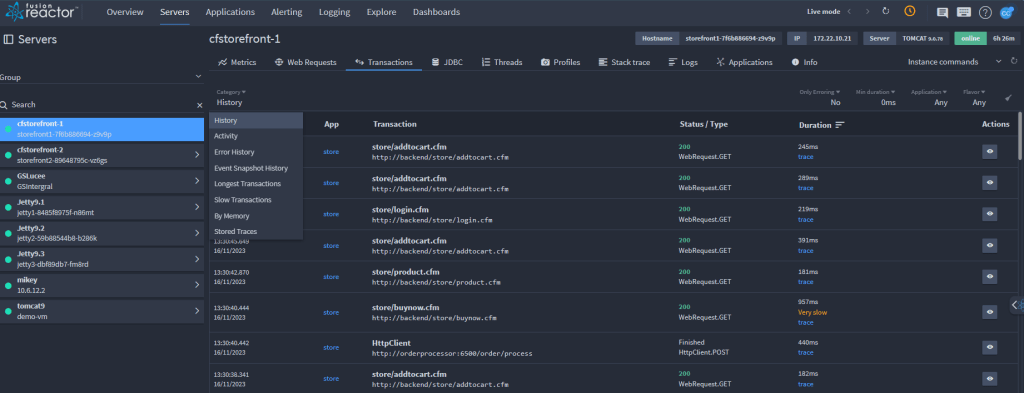
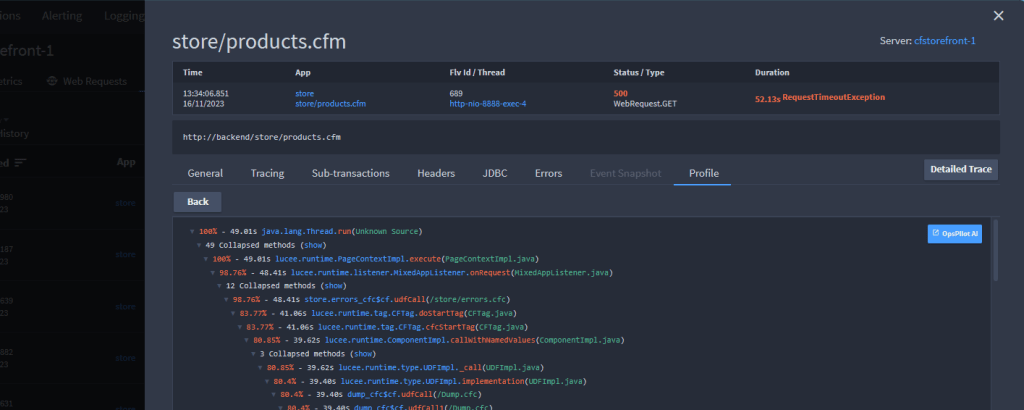
FusionReactor’s Profiler is a game-changer in the realm of performance optimization. Its lightweight and user-friendly design make it an ideal choice for production environments. The profiler automatically profiles every request and transaction running on the Java Virtual Machine (JVM), covering a wide range of applications like Tomcat, JBoss, WildFly, Glassfish, Jetty, and more. ColdFusion applications are also well within its profiling capability.
What sets FusionReactor’s Profiler apart is its automatic operation. It ensures that no issue goes unnoticed, providing a comprehensive and uninterrupted performance analysis. This automatic profiling is securely stored, giving you the freedom to analyze data at your convenience, which is crucial for in-depth performance analysis and troubleshooting.
Pinpointing issues with Event Snapshots
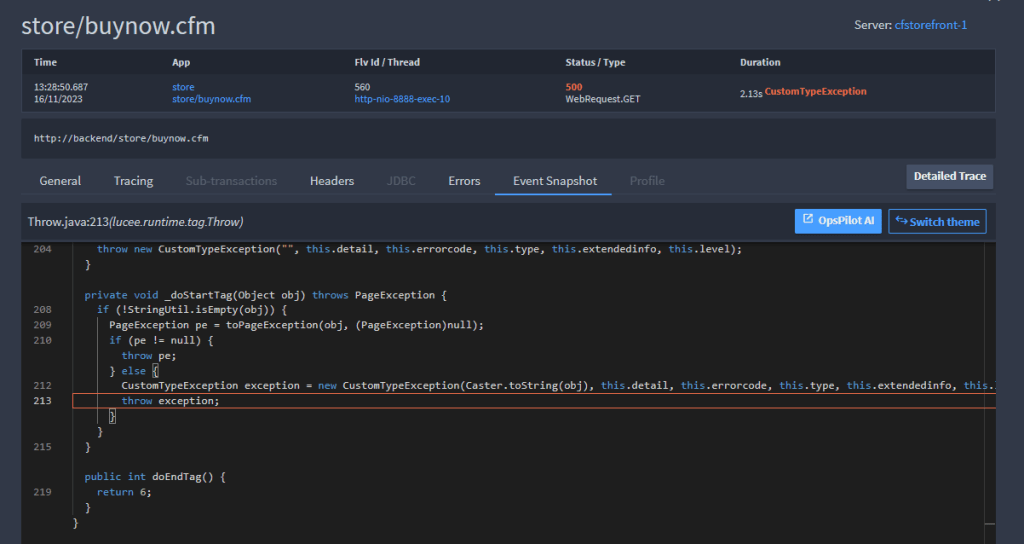
Understanding the root cause of an issue is essential in resolving it efficiently. FusionReactor’s Event Snapshots are designed to do just that. They pinpoint the exact line of code where an error occurred, providing context with the current stack frame and variable scope. This level of detail is invaluable for developers and IT professionals aiming to quickly and effectively address issues.
Moreover, our root cause analysis feature automatically captures and renders Event Snapshots. FusionReactor’s intelligent analysis and rate-limiting ensure that you’re not overwhelmed by repeated issues, allowing a better spread of analytical insight.
Unleashing database potential
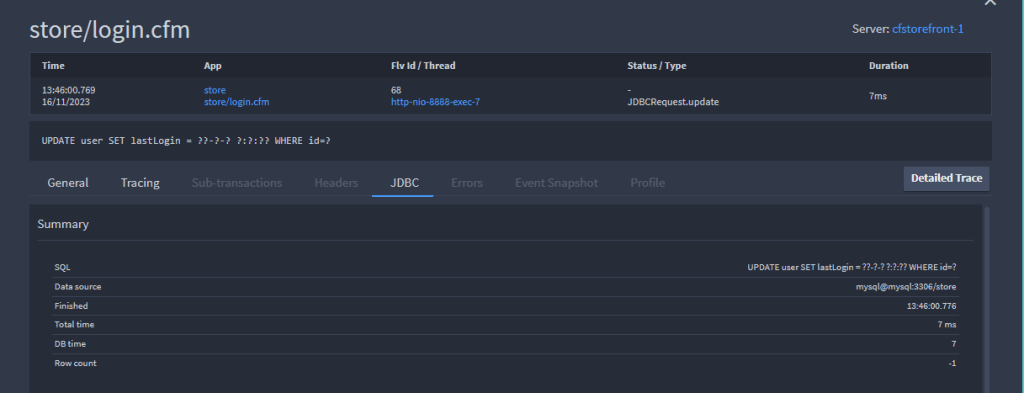
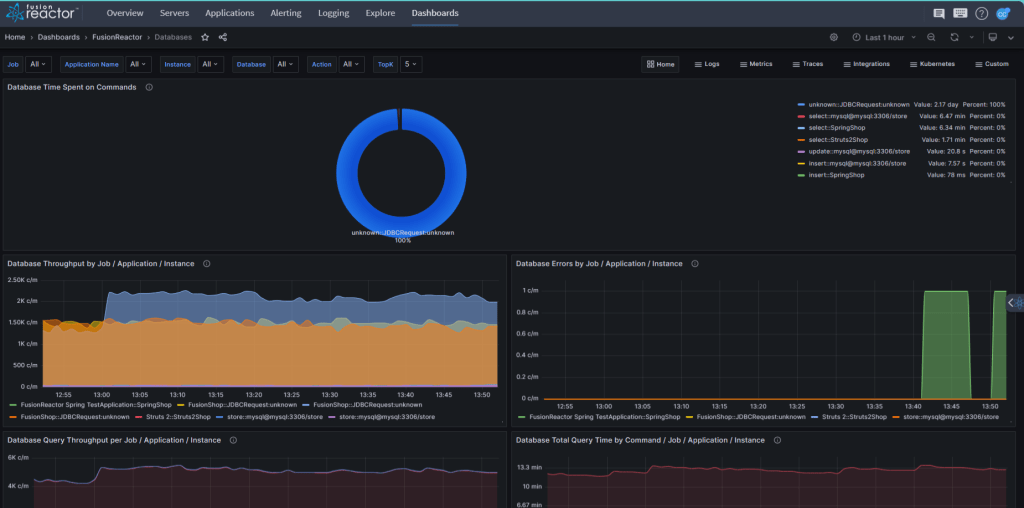
FusionReactor doesn’t just stop at application performance; it also extends its prowess to database optimization. With its comprehensive monitoring, you can ensure lightning-fast response times and unparalleled user experiences. All database requests are tracked as JDBC requests, enabling you to pinpoint and optimize slow SQL transactions.
The intuitive, graphical dashboards make visualizing and exploring your database data easy. You can observe database activity, including throughput, time, total queries, and error rate. This visibility is key in pinpointing database performance issues, optimizing your app’s data storage, and reducing customer load time.
Conclusion – Optimize your Java and CF environment
FusionReactor is more than just a tool; it’s a comprehensive solution for Java and CF environments looking to achieve peak performance. By integrating our Profiler, Event Snapshot, and database monitor into your workflow, you can ensure your applications are running efficiently and providing the best possible experience for your users. Experience the power of FusionReactor and take control of your application’s performance today.

