We are thrilled to announce the official release of FusionReactor 2026.1.3! At FusionReactor, we are continuously striving to make your application performance monitoring smoother, safer, and more powerful. This latest update focuses on supercharging your FRAPI capabilities, reinforcing your data … Read More


Mastering Custom Metrics in the New FusionReactor OTel Era
How to ensure your business-critical KPIs reach OpsPilot and Grafana While FusionReactor’s native OTel support simplifies standard observability, successfully capturing custom application metrics (from OTel SDK or ColdFusion/Lucee) requires adherence to a critical distinction. The key to maintaining your business-critical … Read More
Simplifying Observability with FusionReactor and Native OTel Support
Why you no longer need to run a standalone OpenTelemetry agent alongside FusionReactor. Historically, achieving full-stack visibility was a balancing act. If you wanted the deep-dive JVM insights, memory analysis, and thread profiling that FusionReactor is famous for, alongside industry-standard … Read More
FusionReactor 2026 Release
FusionReactor has released version 2026 of its agent today. Download it here. Enhanced Metrics & Observability We’ve significantly expanded the data you can extract from your environment, offering deeper insights into ColdFusion and Java performance.• Expanded Request Tracking: New, high-fidelity … Read More
FusionReactor Q2 2026 Update: OpenTelemetry Support and Native Alerting
FusionReactor is evolving from a locked-in monitoring tool to an open data source. Starting in Q2 2026, the FusionReactor Agent will allow teams to export high-fidelity ColdFusion and Java telemetry to any OpenTelemetry-compatible backend—without a mandatory OpsPilot subscription. Streamline Your … Read More
One-Click Observability: Instantly Extend FusionReactor with OpsPilot
At Intergral, our goal has always been simple: Give you complete visibility into your applications—without adding complexity.Today, we’re taking a major step forward. We’re introducing One-Click — a new capability that allows you to instantly extend your existing FusionReactor setup … Read More
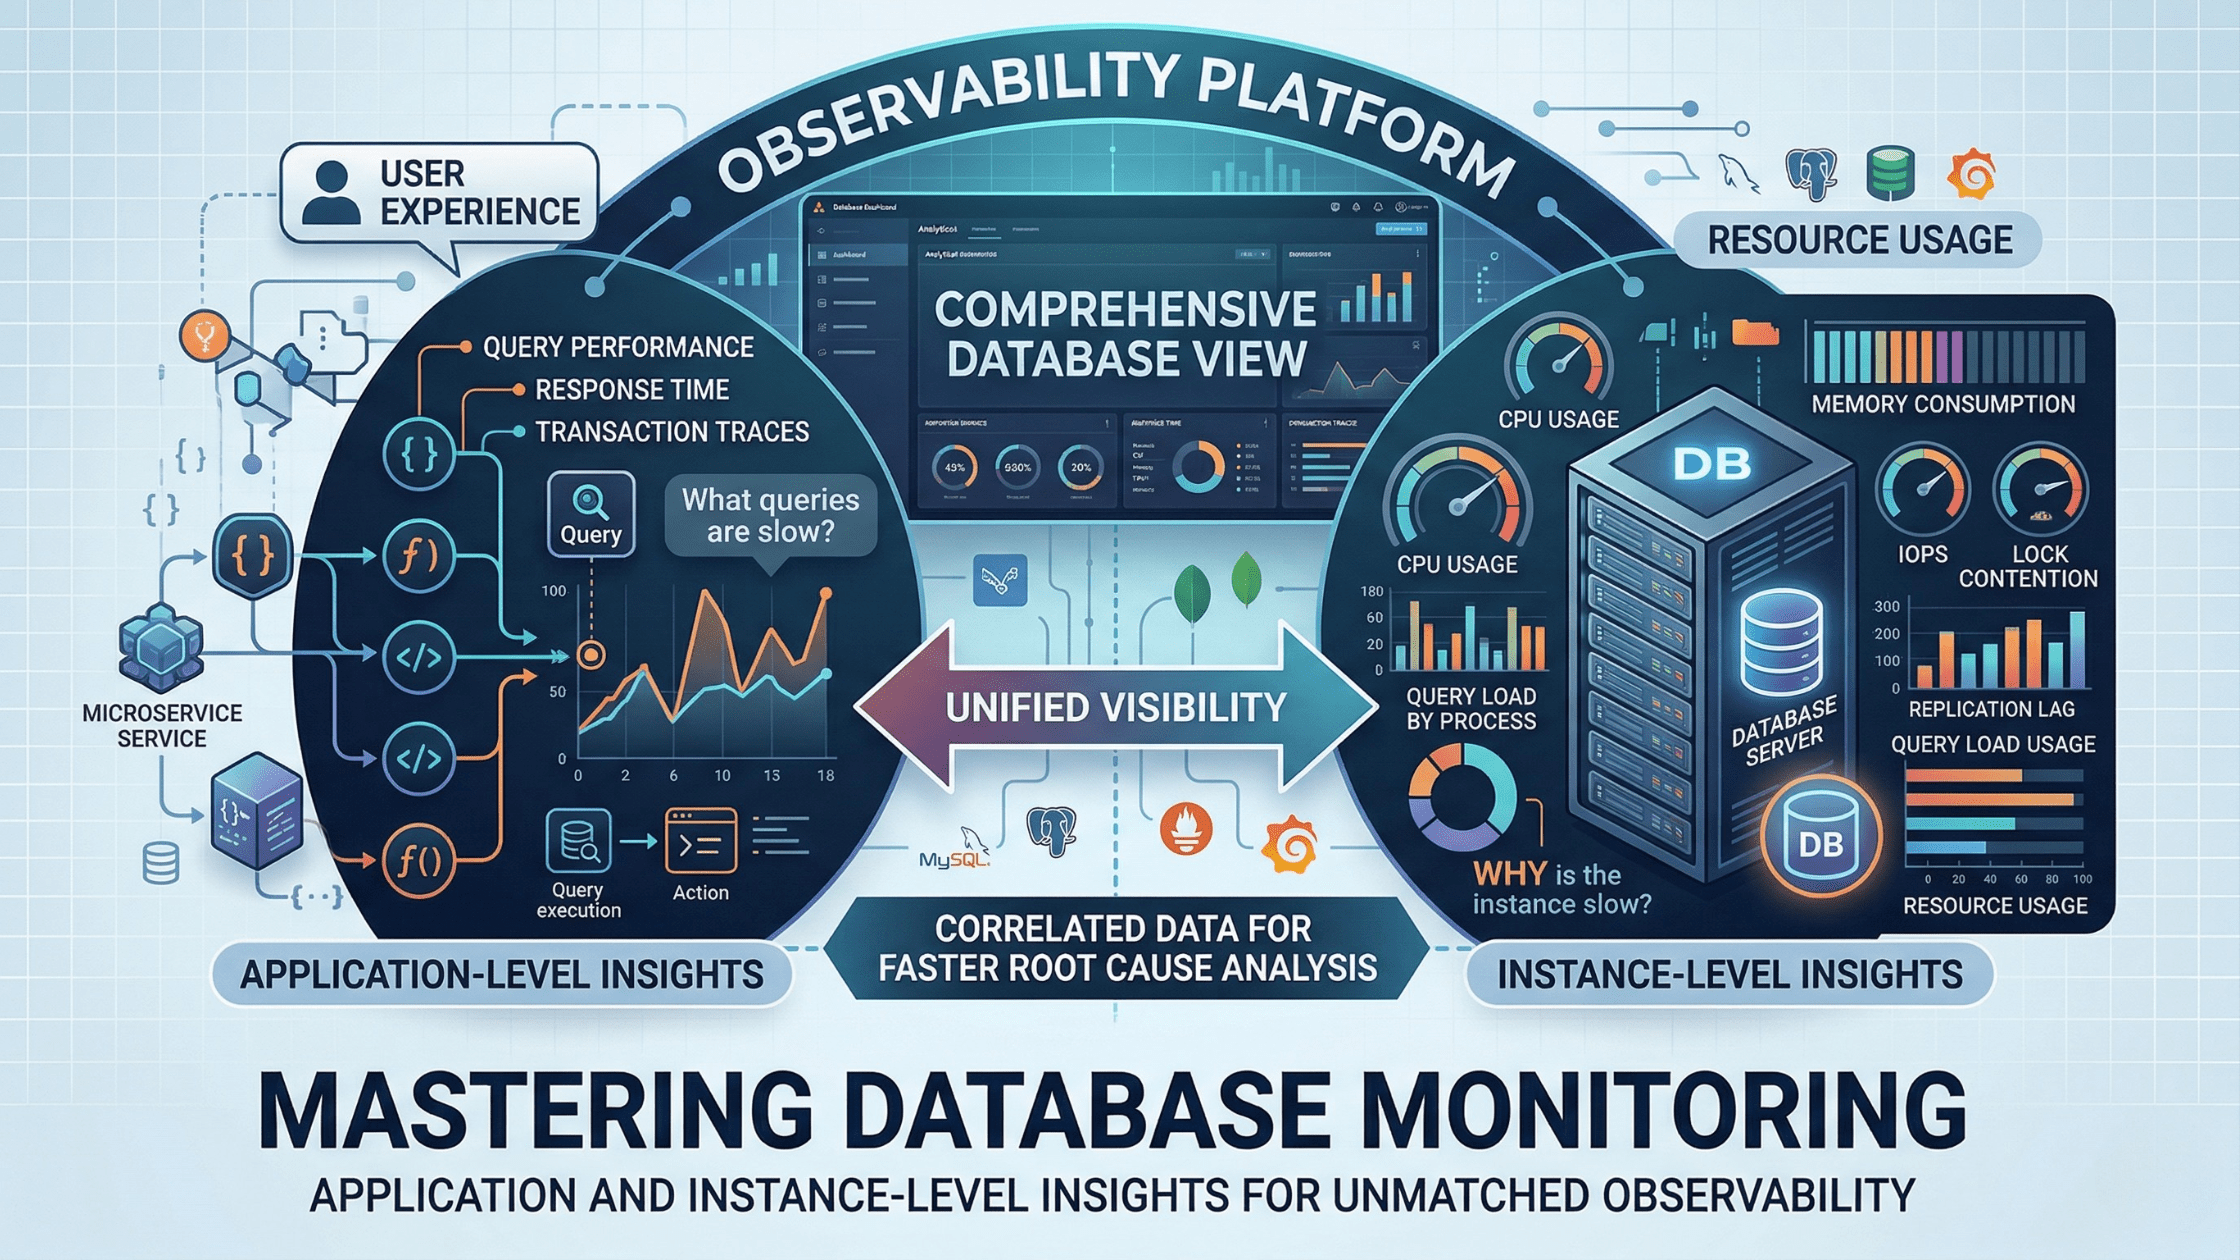
Mastering Database Monitoring: Why Your Observability Platform Needs Both Application and Instance-Level Insights
Database performance issues are among the most challenging problems in modern application environments. A slow query can cascade through your entire system, affecting user experience and business operations. Yet many organizations struggle with incomplete visibility into their database performance, relying … Read More
Coming Soon | FusionReactor Product Update | Q2 2026
Your Instrumentation, Your Backend: The FusionReactor Agent Is Getting a Lot More Flexible FusionReactor has always offered something no other observability tool can match: deep, out-of-the-box instrumentation for ColdFusion applications. The kind of insight — CFML request transactions, query performance, … Read More
Evolving FusionReactor On-Premise Licensing for Greater Flexibility and Consistency
As part of our ongoing efforts to simplify and modernise FusionReactor, we’re introducing an update to the way on-premises licensing works. This change is designed to bring greater consistency across our platform, align with how many of our customers … Read More
Escaping Hotfix Hell: How FusionReactor Stops the Firefighting Cycle
Summary: FusionReactor is an APM and profiling tool for ColdFusion and Lucee CFML applications. It solves operational fragility in legacy systems by providing real-time heap profiling, transaction tracing, thread analysis, and deployment baselining — without requiring a runtime migration or … Read More

Cached ColdFusion Components: Elegant Pattern, Hidden Risk
Ben Nadel’s scoped proxy technique is clever architecture — but what happens when that shared state silently misbehaves at 2am? Here’s how to build the pattern with confidence. FusionReactor Team | March 2026 | 8 min read Note: This post … Read More
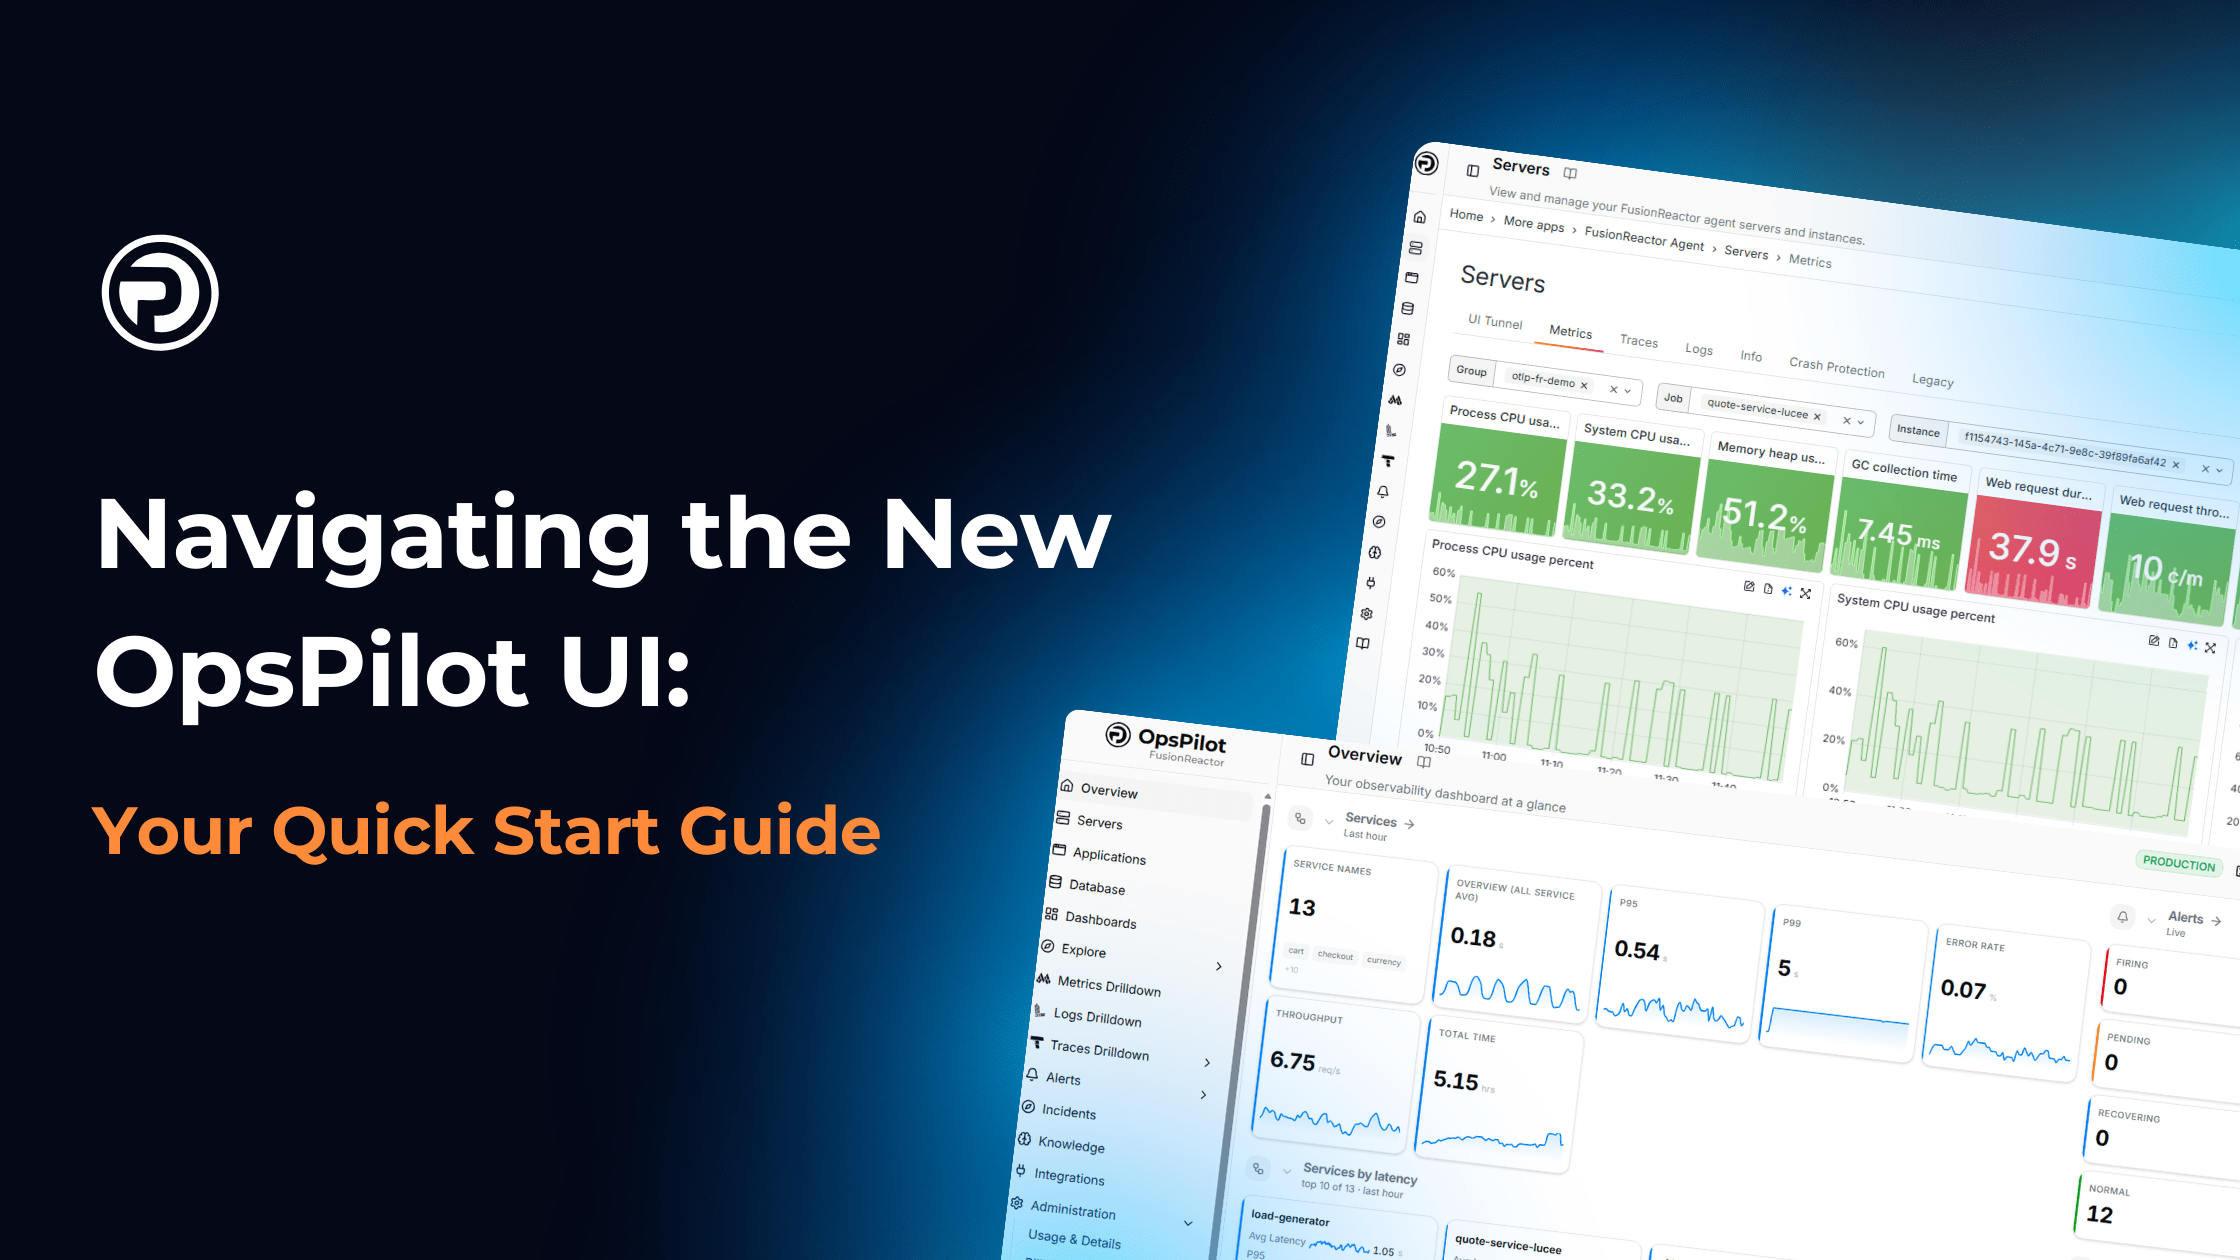
Navigating the New OpsPilot UI: Your Quick Start Guide
Change is good, but finding your favorite features in a brand-new interface can feel like looking for your keys in the dark. To help you get up to speed with the new OpsPilot UI, we’ve rounded up the most common … Read More
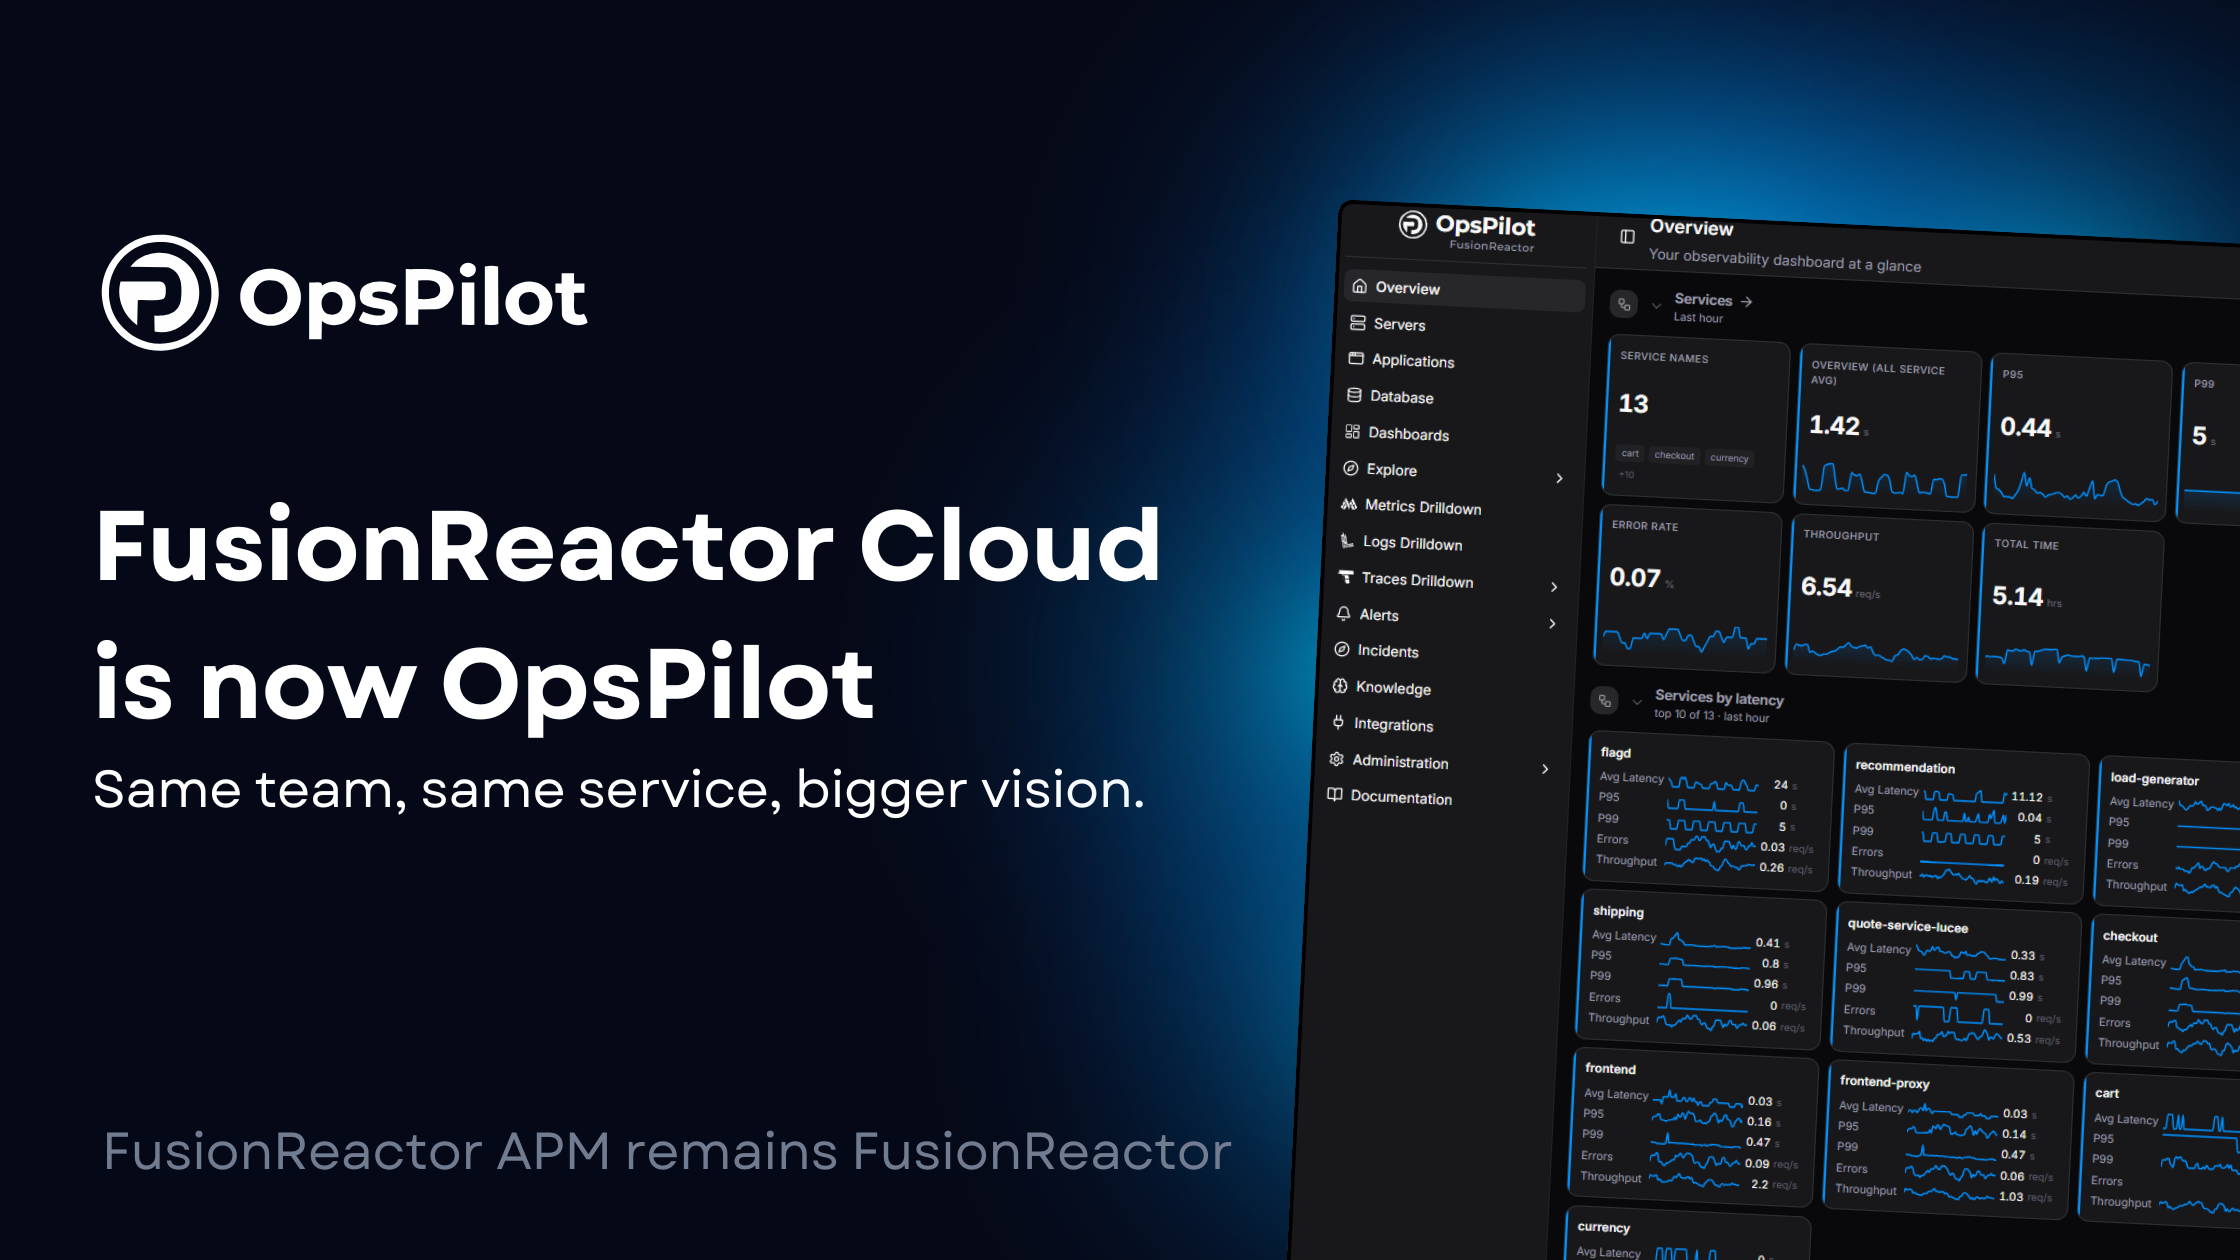
FusionReactor Cloud is Now OpsPilot
Same platform. Same team. Bigger vision. Today marks an important milestone for us: FusionReactor Cloud is officially becoming OpsPilot. Before anything else, we want to be absolutely clear about what this means. This rename only applies to FusionReactor Cloud.FusionReactor APM … Read More

The FusionReactor Take: Claude Sonnet 4.6
1. From “Experimental” to “Enterprise-Ready” Computer Use The most significant operational takeaway is the leap in OSWorld scores. For an Ops manager, “computer use” is the holy grail of automation. The Problem: Most legacy enterprise software lacks APIs. The Solution: … Read More

The FusionReactor Guide: Relocating CF ScriptSrc
Phase 1: Preparation & Migration Before touching the config, we need to ensure the physical assets are ready. Physical Move: Create your new directory (e.g., C:/cf_scripts). Sync Assets: Copy the contents from {cf_root}/cfusion/wwwroot/cf_scripts to the new location. Ops Tip: Use … Read More
OpenTelemetry Collector vs. Grafana Alloy: Which Should You Choose?
In the world of modern observability, the “Sorting Office” of your telemetry data is just as important as the data itself. Whether you are shipping traces, metrics, or logs to FusionReactor Cloud, you generally have two main choices: the industry-standard … Read More

FusionReactor Platform Comparison: Complete Observability Landscape Analysis
FusionReactor vs The Competition: What Teams Actually Find When They Compare An honest look at how FusionReactor compares to major observability platforms — based on published capabilities, independent user ratings, and verified review data. Updated June 2026 · FusionReactor is … Read More
FusionReactor Vs SolarWinds
FusionReactor vs SolarWinds APM: What Teams Actually Find When They Compare An honest comparison of application-first APM against infrastructure-first monitoring — based on independent user ratings and published capabilities. Updated June 2026 · FusionReactor is the on-premises APM agent · … Read More
FusionReactor Vs Elastic APM
FusionReactor vs Elastic APM: What Teams Actually Find When They Compare An honest comparison of dedicated on-premises APM against Elastic Stack extension — based on independent user ratings, published capabilities, and an important data context note. Updated June 2026 · … Read More
FusionReactor vs Honeycomb
FusionReactor vs Honeycomb: What Teams Actually Find When They Compare An honest comparison of traditional on-premises APM against observability-first exploration — with an important note on data limitations. Updated June 2026 · FusionReactor is the on-premises APM agent · Explore … Read More
FusionReactor Vs Grafana
FusionReactor vs Grafana Labs: What Teams Actually Find When They Compare An honest comparison of on-premises APM against the visualization platform — and why many teams end up with both through OpsPilot. Updated June 2026 · FusionReactor is the on-premises … Read More
FusionReactor Vs Sentry
FusionReactor vs Sentry: What Teams Actually Find When They Compare An honest comparison of on-premises APM depth against developer-first error tracking — based on independent user ratings and published capabilities. Updated June 2026 · FusionReactor is the on-premises APM agent … Read More
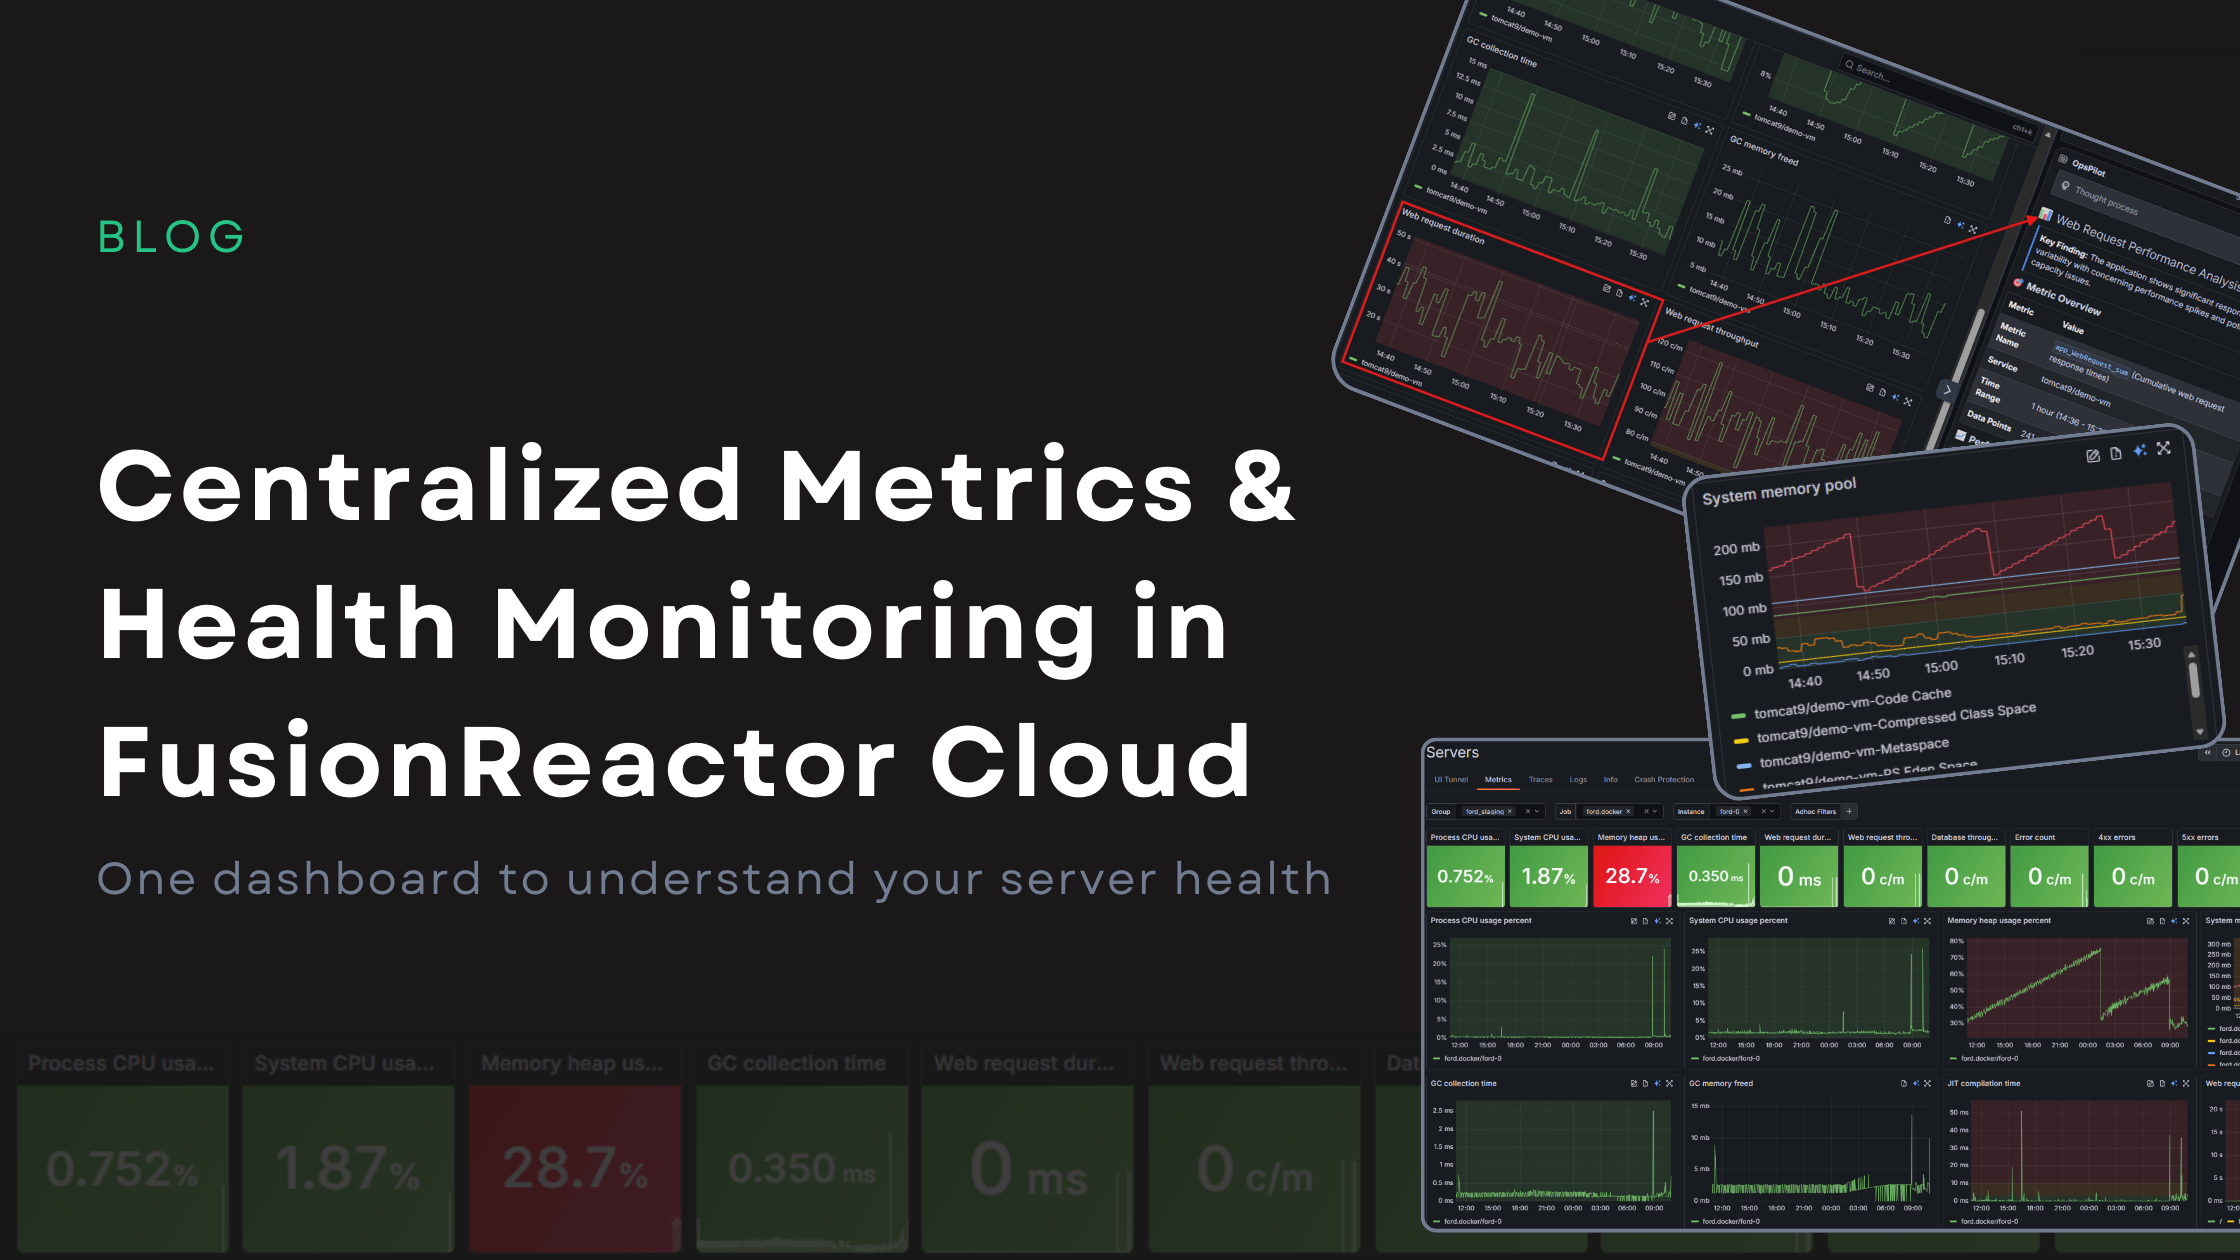
Centralized Metrics and Health Monitoring in FusionReactor Cloud
Centralized Metrics: One Dashboard for Complete Server Health in FusionReactor Cloud Metrics are only useful if they help you take action. FusionReactor Cloud’s new Centralized Metrics Viewer turns raw monitoring data into clear, meaningful visual indicators, making it easy to … Read More
FusionReactor Vs New Relic
FusionReactor vs New Relic: What Teams Actually Find When They Compare An honest comparison of dedicated on-premises APM against the full-stack observability platform — based on independent user ratings and published capabilities. Updated June 2026 · FusionReactor is the on-premises … Read More
FusionReactor Vs Splunk
FusionReactor vs Splunk: What Teams Actually Find When They Compare An honest comparison of dedicated on-premises APM against the enterprise log aggregation and SIEM platform — based on independent user ratings and published capabilities. Updated June 2026 · FusionReactor is … Read More
FusionReactor VS Dynatrace
FusionReactor vs Dynatrace: What Teams Actually Find When They Compare An honest comparison of dedicated on-premises APM against the enterprise observability platform — based on independent user ratings and published capabilities. Updated June 2026 · FusionReactor is the on-premises APM … Read More

OpsPilot: AI Troubleshooting & Root Cause Analysis Built Into FusionReactor Cloud
FusionReactor Cloud offers powerful AI troubleshooting, designed not just to show you what went wrong, but also to immediately help you understand the “why” and move straight to the fix. With OpsPilot, FusionReactor’s revolutionary AI assistant, artificial intelligence is no longer … Read More


