Imagine this: you’re in the middle of a packed workday when your server suddenly crashes. Everything grinds to a halt. You’re now racing against the clock to find out what happened—and get your systems back online as quickly as possible.
This is exactly where FusionReactor steps in to support you.
In this article, we’ll walk through a real-world server crash scenario using FusionReactor On-Premise. You’ll see how its built-in tools help you respond to a server crash and how you can take proactive steps to stop it from happening again.
Rewinding the Timeline: Investigating with Archive Viewer
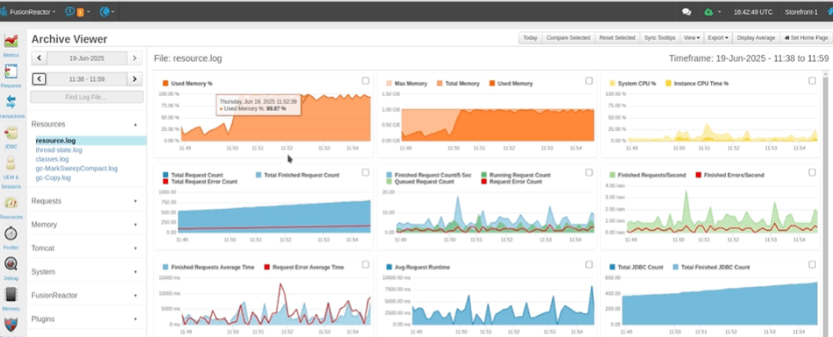
One of the first tools to turn to is Archive Viewer, a powerful feature that allows you to step back in time and view archived log rotations. This is especially helpful when you’re piecing together what was happening on the server in the moments leading up to a crash.
In the example below, we notice that memory usage spiked at 11:49 and stayed high until the crash occurred 14 minutes later. While the logs were cut off due to an hourly rotation, the pattern was still clear enough to raise a red flag.
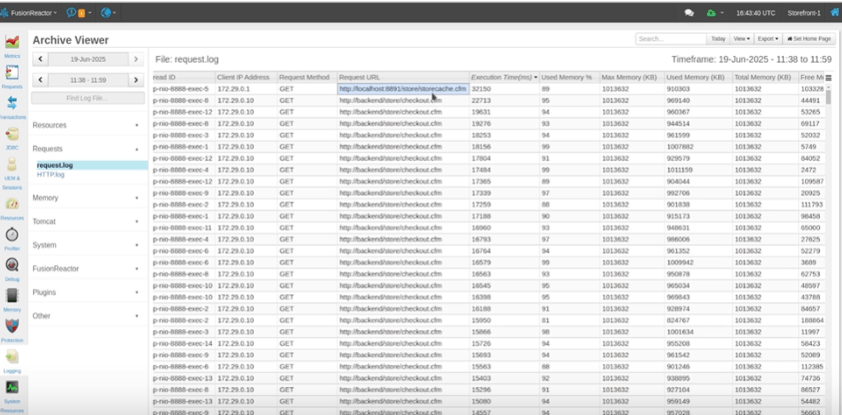
From there, we dove into the Request Log to identify what was happening at the time of the spike. By sorting the log entries by execution time, we spotted a “Store Cache” request that completed just as memory maxed out. Immediately after, other requests began to slow down—strongly suggesting this request was the tipping point.
Confirming the Root Cause with Log Insights
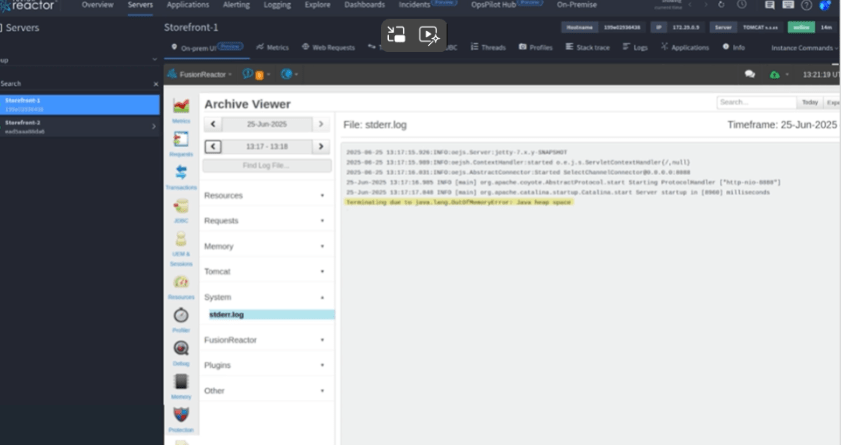
To validate our suspicion, we checked the system logs for any errors tied to the crash. Sure enough, we found an ‘Out of Memory’ error logged just moments before the crash—clear confirmation of what brought the system down.
Moving from Reaction to Prevention: Crash Protection
Once you’ve identified the cause, the next question is: how can you prevent this from happening again?
FusionReactor’s Crash Protection feature, available in the On-Premise dashboard, is designed to help you do exactly that. It lets you configure alerts for:
- Long-running or high-frequency requests
- High CPU usage
- Java memory thresholds
To get started, you’ll need to set up email notifications. To reduce unnecessary alerts, you can also configure it to ignore known long-running requests.
What makes Crash Protection even more powerful is its ability to handle problems in real-time. You can choose whether to queue, throttle, or abort problematic requests, and apply these strategies to specific endpoints or routes.
You’ll even receive a notification like the one shown in the video, giving you immediate insight into what was caught and how it was handled.
Dig Deeper with JDBC Logs
If your application makes frequent database calls, JDBC logging can be another invaluable tool.
You can enable it via the On-Premise interface under JDBC > Settings, and toggle JDBC logging to Enabled. Once active, this feature logs every SQL statement executed by your application. Each entry includes both the query and the associated stack trace, making it easy to trace performance issues back to their source.
These logs can be viewed through the Archive Viewer and customized and retained according to your environment’s needs.
Bringing It All Together
FusionReactor On-Premise provides a comprehensive toolkit for quickly and thoroughly diagnosing server crashes. From visual log analysis with Archive Viewer, to real-time protection via Crash Protection, and deep insight through JDBC Logs, you have everything you need to both respond to incidents and prevent future downtime.
Don’t just recover—stay ahead of the problem.


