

What is an APM (Application Performance Monitor)
Application Performance Monitors (APMs) help developers and DevOps professionals improve the performance of an application and identify errors and exceptions in the code. So, the APM identifies and diagnoses complex application performance problems to maintain an expected level of service. Consequently, an APM’s role within an organization is to take complex metrics and turn them into actionable insight.
Who uses APM’s and why
IT Operations
It is usually the responsibility of IT operations teams to keep the infrastructure running smoothly. However, according to research by Gartner, IT operations can have a wide variety of responsibilities.
It Services Monitoring 84%
DevOps/AppDev
For DevOps release teams to find and diagnose problems rapidly, they must quickly assess the quality (and effectiveness) of recent releases.
Debugging and profiling 34%
IT services monitoring 44%
Using an APM with monolithic servers
It has always been relatively easy to monitor and fix software applications since they were typically built on a single server. Many of the larger APM’s no longer support monolith servers and advise the migration to distributed services. FusionReactor however is committed to continuing to develop its on-premise APM which is the ideal tool for finding issues in apps built on monoliths.
Migrating older apps to distributed servers is not always the best option
In a recent survey, 50% of developers used a combination of monoliths and distributed environments. This is because many older applications are vital for infrastructure but suffer from technical debt and code decay. Rewriting them is not really an option as they function ok and the development of new applications often delivers a higher ROI. Monitoring monoliths is still just as important, arguably more so as often they are written in older code that modern developers simply no longer learn. On-premise APM’s like FusionReactor enable these older applications to continue to run efficiently without the need to recode or migrate.
Monitoring a JVM
JVM (Java Virtual Machine) is at the heart of the Java application architecture. In essence, it interprets and converts Java byte code into host platform operations. When the Java Virtual Machine (JVM), used by all Java middleware, such as Tomcat, JBoss EAP, WildFly, GlassFish, and WebSphere, is experiencing performance problems, the impact on the services they support is significant.
Any Java APM strategy must include JVM monitoring. Therefore, to troubleshoot server-side bottlenecks, IT Ops and DevOps teams use JVM performance metrics and by discovering code-level issues, JVM monitoring can also be helpful to developers and architects.
 An APM analyzes hundreds of JVM performance metrics and identifies code-level bottlenecks including thread synchronization issues, deadlocks, memory leaks, GC issues, and application configuration issues such as insufficient heap memory.
The IT architecture of organizations has become much more complicated since the widespread use of containerized environments, Dockers, and Kubernetes managed environments. Because an application’s code is often distributed among a number of microservices, monitoring isn’t as easy as it used to be.
Monitoring distributed applications
In order to troubleshoot distributed applications, it is essential to have holistic, centralized dashboards that incorporate metrics from across all servers.
Following a trace is no longer simple and many traditional APM’s fail to give valuable insight over and above a timestamp out when the event occurs on a different server and a timestamp in when the event returns to the monolith server. Distributed tracing is now needed in order to obtain end-to-end visibility of the full infrastructure. Transactions can be tracked from server to server, providing a holistic view of the entire application.
Log monitoring must allow for the developer to ingest logs and allow queries, analysis, visualization, and alerting from the entire infrastructure.
The 3 pillars of observability
The APM holy trinity of Metrics, logs, and traces do not necessarily make systems more observable, but they do help in creating better systems by generating a huge volume of insight.

Low-level APM capabilities
Automatic Root Cause Analysis
Automated Root Cause Analysis (RCA) informs the developer immediately when a critical error or exception occurs. FusionReactors’ Event Snapshot provides developers with a complete source code, stack trace, variable, and environment state of an error at the point of occurrence. This saves hours of time debugging and dramatically reduces Mean Time to Detect (MTTD).
Debugging
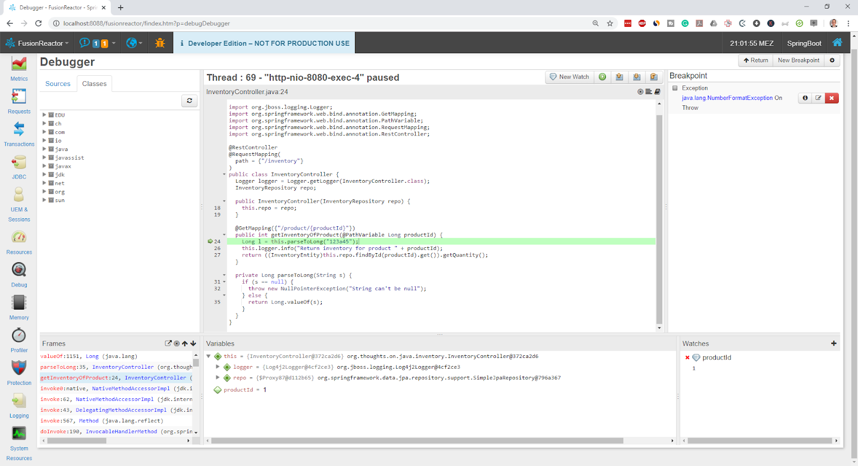
Keeping production bugs from hitting production has always been a priority, with multiple QA phases, staging environments, and automation. However, sometimes bugs will make their way into production. Therefore, when they do, we need a strategy to handle them safely and efficiently.
With modern debugging tools, you can now safely and reliably debug in a production environment without disrupting users or causing downtime.
What makes it safe to debug in production?
If you need to debug in production, there are a few things to ensure when doing so;
- Debugging does not have a significant impact on performance
- It is still possible to use your app and debug at the same time
- There is no external access to secure data
- Debugging is providing enough information for you to locate and fix the problem as soon as possible.
If you are debugging, you want as much information as possible in the least amount of time. Jumping between multiple systems and retrying to fix the bugs several times only adds to the stress of dealing with a critical problem.
How to use Root Cause Analysis to find critical issues
Continuous profiling
The term continuous profiling refers to the ongoing collection of application performance data. Consequently, developers use this data for deep analysis in production environments.
You use continuous profiling to figure out which components, methods, or lines of code are the most resource-intensive. The developer can use this insight to improve the performance of the profiled application and understand runtime behavior.
FusionRector Ultimate has a number of profiling tools including
Continuous code profiler
With the Code Profiler, you can easily run code performance analysis at low overhead in your production environment. Because profiles are generated automatically, you won’t miss any issues.
The Code profiler in FusionReactor provides instant insight into how your application is performing, down to the method level.
Continuous Thread profiler
You can track down performance issues efficiently and quickly using continuous thread profiling and stack trace analysis. Through an APM that includes a thread profiler like FusionReactor, an individual thread can be quickly profiled or stacked to identify performance, deadlock, and concurrency issues.
Continuous memory profiler
Continuous memory profilers give you a detailed insight into Java memory spaces and garbage collection. Consequently, with the FusionReactor low overhead memory profiler, you can identify memory leaks and optimize memory usage in your production Java applications and get instant insight into the heap.
What is a memory leak?
A memory leak takes place because of a defect in an application. Consequently, a memory leak occurs when an object retains memory and cannot be collected because it is referenced by another live object. Therefore, leaked objects are accessible from at least one GC Root or are themselves GC Roots. Therefore, every leaked object has a path that starts with GC Roots and contains (ends with) the leaked object.
The memory profiler detects possible memory leaks or excessive object creation in real-time using heap utilization.
Continuous CPU profiler
Having a CPU profiler in your APM allows you to find and tune inefficient processes running on your application server.
The low-overhead Java Profiler allows you to see what code is being executed. Therefore allowing you to determine what functions are running that could slow a thread down.
How to use profiling to find performance issues
How to find memory leaks in Java
A changing APM landscape
The APM landscape is rapidly evolving if investing in an APM you need to look for a degree of future-proofing. The terms APM and observability are for many synonymous, it is important to understand the differences between the two terms; one is not a substitute for the other. To make a solid investment you need to understand the benefits of the APM and having an observability platform. Modern APM’s and observability platforms are happy to use open-source and Open Telemetry (OTel) as it takes the heavy lifting out of coding and puts the onus on enabling the customer to fix performance and coding issues faster.
The Observability platform with APM capability is moving away from a developer or DevOps tool to be becoming organizationally centric. The platform should be able to ingest data from a wide variety of tools. As a result, enabling a truly holistic view of an organization’s architecture.
As the adoption of OTel increases then it is without a doubt that this is the way forward for both Observability and the APM. APM’s no longer need to develop many agents and try and keep up to date with emerging technologies.